Durable Goods Doesn’t Wow Markets

Good Morning Traders,
As of this writing 4 AM EST, here’s what we see:
US Dollar: Dec. USD is Down at 98.735.
Energies: December Crude is Down at 49.51.
Financials: The Dec 30 year bond is Down 13 ticks and trading at 162.01.
Indices: The December S&P 500 emini ES contract is 15 ticks lower and trading at 2119.75.
Gold: The December gold contract is trading Down at 1268.30. Gold is 12 ticks lower than its close.
Initial Conclusion
This is not a correlated market. The dollar is Down- and crude is Down- which is not normal and the 30 year bond is trading Down. The Financials should always correlate with the US dollar such that if the dollar is lower then bonds should follow and vice-versa. The indices are Up and Crude is trading Down which is correlated. Gold is trading Down which is not correlated with the US dollar trading Down. I tend to believe that Gold has an inverse relationship with the US Dollar as when the US Dollar is down, Gold tends to rise in value and vice-versa. Think of it as a seesaw, when one is up the other should be down. I point this out to you to make you aware that when we don’t have a correlated market, it means something is wrong. As traders you need to be aware of this and proceed with your eyes wide open.
Asia traded mainly lower with the exception of the Nikkei exchange which traded higher. As of this writing all of Europe is trading lower.
Possible Challenges To Traders Today
– Advance GDP q/q is out at 8:30 AM EST. This is major.
– Advance GDP Price Index is out at 8:30 AM. This is major.
– Employment Cost Index is out at 8:30 AM EST. This is major.
– Revised UoM Consumer Sentiment is out at 10 AM. This is not major.
– Revised UoM Inflation Expectations is out at 10 AM. This is not major.
Treasuries
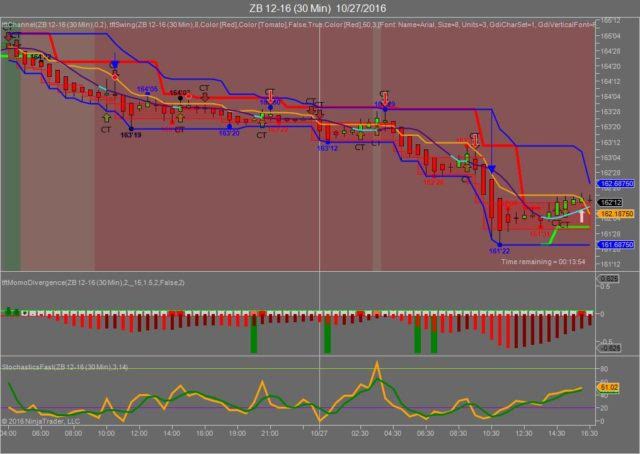
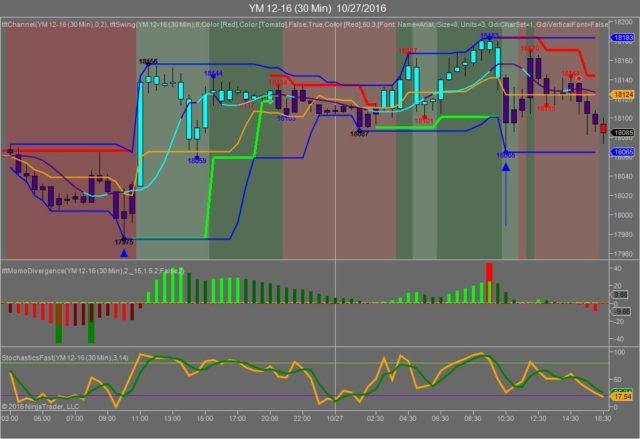
We’ve elected to switch gears a bit and show correlation between the 30 year bond (ZB) and The YM futures contract. The YM contract is the DJIA and the purpose is to show reverse correlation between the two instruments. Remember it’s liken to a seesaw, when up goes up the other should go down and vice versa.
Yesterday the ZB made it’s move at around 10:30 AM EST with no economic news in sight. The ZB hit a high at around that time and the YM hit a low. If you look at the charts below ZB gave a signal at around 10:30 AM EST and the YM was moving higher at the same time. Look at the charts below and you’ll see a pattern for both assets. ZB hit a high at around 10:30 AM EST and the YM hit a low. These charts represent the latest version of Trend Following Trades and I’ve changed the timeframe to a 30 minute chart to display better. This represented a shorting opportunity on the 30 year bond, as a trader you could have netted about 20 plus ticks per contract on this trade. Each tick is worth $31.25. We added a Donchian Channel to the charts to show the signals more clearly.
Charts Courtesy of Trend Following Trades built on a NinjaTrader platform
Bias
Yesterday we gave the markets a neutral bias as the USD and Gold were both trading higher yesterday morning and this usually represents a downside bias however the indices were pointed higher, hence the neutral bias. The Dow dropped 30 points and the other indices lost ground as well. Today we aren’t dealing with a correlated market and will maintain a neutral bias.
Could this change? Of Course. Remember anything can happen in a volatile market.
Commentary
Yesterday morning the indices looked as though they might gain ground for the day. The problem was the USD and Gold were both trading higher yesterday and this should equate to a negative for the indices. The indices however were all trading higher hence the neutral bias which means the markets could go in any direction. By 10 AM EST it was pretty clear that the markets would go lower. The Durable Goods numbers came in at -0.1% versus a +0.1% expected. It is hoped that the Fed will keep this in mind should they decide to hike….
Author

Nick Mastrandrea
Market Tea Leaves


