Downslide keeps on keeping on [Video]
![Downslide keeps on keeping on [Video]](https://editorial.fxstreet.com/images/Markets/Currencies/Majors/DollarIndex/close-up-look-of-markets-various-bills-1775965_XtraLarge.jpg)
US Dollar: Sep '22 USD is Up at 109.030.
Energies: Oct '22 Crude is Down at 87.45.
Financials: The Dec '22 30 Year bond is Down 29 ticks and trading at 134.30.
Indices: The Sep '22 S&P 500 emini ES contract is 118 ticks Lower and trading at 3927.00.
Gold: The Dec'22 Gold contract is trading Down at 1713.60. Gold is 126 ticks Lower than its close.
Initial conclusion
This is not a correlated market. The dollar is Up, and Crude is Down which is normal, but the 30-year Bond is trading Lower. The Financials should always correlate with the US dollar such that if the dollar is lower, then the bonds should follow and vice-versa. The S&P is Lower, and Crude is trading Lower which is not correlated. Gold is trading Lower which is correlated with the US dollar trading Up. I tend to believe that Gold has an inverse relationship with the US Dollar as when the US Dollar is down, Gold tends to rise in value and vice-versa. Think of it as a seesaw, when one is up the other should be down. I point this out to you to make you aware that when we don't have a correlated market, it means something is wrong. As traders you need to be aware of this and proceed with your eyes wide open. Asia is trading mainly Lower with the exception the Singapore exchange which is fractionally Higher. Currently all of Europe is trading Lower.
Possible challenges to traders today
-
Challenger Job Cuts is out at 7:30 AM EST. This is Major.
-
Unemployment Claims is out at 8:30 AM EST. Major
-
Revised Nonfarm Productivity is out at 8:30 AM. Not Major.
-
Revised Unit Labor Costs is out at 8:30 AM. Not Major.
-
Final Manufacturing PMI is out at 9:45 AM EST. Major.
-
ISM Manufacturing PMI is out at 10 AM EST. Major.
-
Construction Spending is out at 10 AM EST. Major.
-
ISM Manufacturing Prices are out at 10 AM EST. Major.
-
Wards Total Vehicle Sales - All Day By Brand.
-
Natural Gas Storage is out at 10:30 AM EST. This is Major.
Treasuries
Traders, please note that we've changed the Bond instrument from the 30 year (ZB) to the 10 year (ZN). They work exactly the same.
We've elected to switch gears a bit and show correlation between the 10-year bond (ZN) and the S&P futures contract. The S&P contract is the Standard and Poor's, and the purpose is to show reverse correlation between the two instruments. Remember it's likened to a seesaw, when up goes up the other should go down and vice versa.
Yesterday the ZN made its move at around 9:30 AM EST. The ZN hit a Low at around that time and the S&P moved Lower shortly thereafter. If you look at the charts below ZN gave a signal at around 9:30 AM EST and the S&P moved Lower at around the same time. Look at the charts below and you'll see a pattern for both assets. ZN hit a Low at around 9:30 AM EST and the S&P was moving Lower shortly thereafter. These charts represent the newest version of MultiCharts and I've changed the timeframe to a 15-minute chart to display better. This represented a Long opportunity on the 10-year note, as a trader you could have netted about a dozen ticks per contract on this trade. Each tick is worth $15.625. Please note: the front month for the ZN is now Dec '22. The S&P contract remains is Sep' 22 for the time being. I've changed the format to Renko Bars such that it may be more apparent and visible.
Charts courtesy of MultiCharts built on an AMP platform
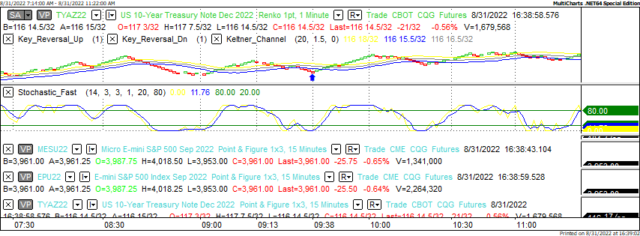
ZN - Dec 2022 - 08/31/22
-637976291612658332.png)
S&P - Sep 2022 - 08/31/22
Bias
Yesterday we gave the markets a Neutral bias as we didn't see much in the way of correlation Wednesday morning. The Dow dropped another 280 points and the other indices lost ground as well. Today we aren't dealing with a correlated market and our bias is Neutral.
Could this change? Of Course. Remember anything can happen in a volatile market.
Commentary
Yesterday morning as we reviewed the markets, they did not seem to have any sense of itself as it was all over the place with no real firm direction, hence the Neutral bias. Once again, the markets veered to the Downside, and this was the third day in a row. One has to wonder how long Fed Chair Powell's remarks will remain in the markets. The news reported yesterday didn't meet expectation but did come reasonably close. Still, this was not enough to propel the markets Higher. Today we have 10 economic reports, most of which are major. It is hoped that these reports can move the markets forward but as in all things, only time will tell.
Author

Nick Mastrandrea
Market Tea Leaves


