US Dollar: March USD is Up at 96.550.

Energies: March '19 Crude is Down at 52.32.

Financials: The Mar 30 year bond is Down 6 ticks and trading at 146.22.

Indices: The Mar S&P 500 emini ES contract is 44 ticks Higher and trading at 2717.25.

Gold: The Feb Gold contract is trading Down at 1312.90. Gold is 59 ticks Lower than its close.

Initial Conclusion

This is not a correlated market.  The dollar is Up+ and Crude is Down- which is normal but the 30 year Bond is trading Lower.  The Financials should always correlate with the US dollar such that if the dollar is lower then bonds should follow and vice-versa. The S&P is Higher and Crude is trading Lower which is correlated. Gold is trading Lower which is correlated with the US dollar trading Higher.   I tend to believe that Gold has an inverse relationship with the US Dollar as when the US Dollar is down, Gold tends to rise in value and vice-versa. Think of it as a seesaw, when one is up the other should be down. I point this out to you to make you aware that when we don't have a correlated market, it means something is wrong. As traders you need to be aware of this and proceed with your eyes wide open.

At this hour Asia is trading Mixed with half the exchanges trading Higher and the other half Lower.  Currently all of Europe is trading Higher at this time.

Possible Challenges To Traders Today

  • Mortgage Delinquencies.  This is not major.

  • FOMC Member Bowman Speaks at 11:15 AM EST.  This is major.

 Treasuries

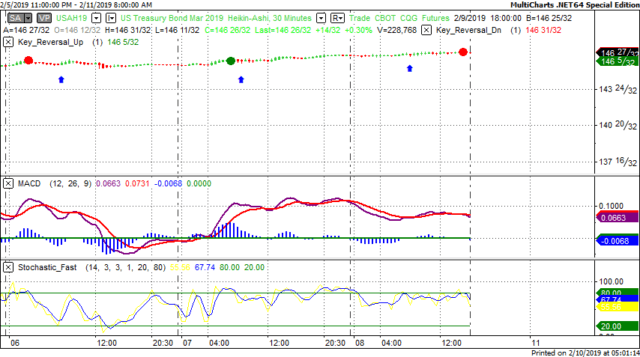
We've elected to switch gears a bit and show correlation between the 30 year bond (ZB) and The YM futures contract.  The YM contract is the DJIA and the purpose is to show reverse correlation between the two instruments.  Remember it's liken to a seesaw, when up goes up the other should go down and vice versa.

On Friday the ZB made a major move at around 8 AM EST.  The ZB hit a Low at around that time and the YM hit a High.  If you look at the charts below ZB gave a signal at around 8 AM EST and the YM was moving Lower at the same time. Look at the charts below and you'll see a pattern for both assets. ZB hit a Low at around 8 AM and the YM was moving Lower at the same time.  These charts represent the newest version of MultiCharts and I've changed the timeframe to a 30 minute chart to display better.  This represented a Long opportunity on the 30 year bond, as a trader you could have netted about a dozen ticks per contract on this trade.  Each tick is worth $31.25.  Please note: the front month for the ZB contract is now March, 2019

Charts Courtesy of MultiCharts built on an AMP platform Click on an image to enlarge it.

ZB

YM

Bias

On Friday we gave the markets a Downside bias as both the USD and the Bonds were trading Higher Friday morning and that doesn't bode well for an Upside day hence the Downside bias.  The Dow dropped 63 points but the other indices managed to eke out a fractional gain.  Today we aren't dealing with a correlated market and our bias is Neutral.

Could this change? Of Course.  Remember anything can happen in a volatile market.

Commentary

Once again the Dow trended to the downside and fell on Friday with a loss of 63 points.  For whatever reason this all seems to stem from the State of the Union address last Tuesday.  Now the analysts and pundits are suggesting and foreseeing a worldwide global slowdown of economies.  But no one is stating as to why that is.  In the US everyone seems to think that the slowdown won't affect the United States.  The prevailing attitude seems to be "we have our tax cuts to keep us going and look at our great jobs numbers".  What everyone seems to forget is that the same situation occured in 2007 when the US had stellar gains in the job market but in December of that year the gains fell to 17,000 net new jobs created when the estimate was in the hundreds of thousands.  Bottom line, things can change and the US is not isolated from the rest of the world.  But as is all things only time will tell....

Trading performance displayed herein is hypothetical. The following Commodity Futures Trading Commission (CFTC) disclaimer should be noted.

Hypothetical performance results have many inherent limitations, some of which are described below. No representation is being made that any account will or is likely to achieve profits or losses similar to those shown.

In fact, there are frequently sharp differences between hypothetical performance results and the actual results subsequently achieved by any particular trading program. One of the limitations of hypothetical performance trading results is that they are generally prepared with the benefit of hindsight.

In addition, hypothetical trading does not involve financial risk, and no hypothetical trading record can completely account for the impact of financial risk in actual trading. For example, the ability to withstand losses or to adhere to a particular trading program in spite of trading losses are material points which can also adversely affect actual trading results.

There are numerous other factors related to the markets in general or to the implementation of any specific trading program which cannot be fully accounted for in the preparation of hypothetical performance results and all of which can adversely affect actual trading results.

Trading in the commodities markets involves substantial risk and YOU CAN LOSE A LOT OF MONEY, and thus is not appropriate for everyone. You should carefully consider your financial condition before trading in these markets, and only risk capital should be used.

In addition, these markets are often liquid, making it difficult to execute orders at desired prices. Also, during periods of extreme volatility, trading in these markets may be halted due to so-called “circuit breakers” put in place by the CME to alleviate such volatility. In the event of a trading halt, it may be difficult or impossible to exit a losing position.

Recommended Content


Recommended Content

Editors’ Picks

AUD/USD posts gain, yet dive below 0.6500 amid Aussie CPI, ahead of US GDP

AUD/USD posts gain, yet dive below 0.6500 amid Aussie CPI, ahead of US GDP

The Aussie Dollar finished Wednesday’s session with decent gains of 0.15% against the US Dollar, yet it retreated from weekly highs of 0.6529, which it hit after a hotter-than-expected inflation report. As the Asian session begins, the AUD/USD trades around 0.6495.

AUD/USD News

USD/JPY finds its highest bids since 1990, approaches 156.00

USD/JPY finds its highest bids since 1990, approaches 156.00

USD/JPY broke into its highest chart territory since June of 1990 on Wednesday, peaking near 155.40 for the first time in 34 years as the Japanese Yen continues to tumble across the broad FX market. 

USD/JPY News

Gold stays firm amid higher US yields as traders await US GDP data

Gold stays firm amid higher US yields as traders await US GDP data

Gold recovers from recent losses, buoyed by market interest despite a stronger US Dollar and higher US Treasury yields. De-escalation of Middle East tensions contributed to increased market stability, denting the appetite for Gold buying.

Gold News

Ethereum suffers slight pullback, Hong Kong spot ETH ETFs to begin trading on April 30

Ethereum suffers slight pullback, Hong Kong spot ETH ETFs to begin trading on April 30

Ethereum suffered a brief decline on Wednesday afternoon despite increased accumulation from whales. This follows Ethereum restaking protocol Renzo restaked ETH crashing from its 1:1 peg with ETH and increased activities surrounding spot Ethereum ETFs.

Read more

Dow Jones Industrial Average hesitates on Wednesday as markets wait for key US data

Dow Jones Industrial Average hesitates on Wednesday as markets wait for key US data

The DJIA stumbled on Wednesday, falling from recent highs near 38,550.00 as investors ease off of Tuesday’s risk appetite. The index recovered as US data continues to vex financial markets that remain overwhelmingly focused on rate cuts from the US Fed.

Read more

Majors

Cryptocurrencies

Signatures