Downslide continues to continue again [Video]
![Downslide continues to continue again [Video]](https://editorial.fxstreet.com/images/Markets/Currencies/Majors/GBPUSD/iStock-1078115946_XtraLarge.jpg)
US Dollar: Dec '22 USD is Down at 103,630.
Energies: Jan '23 Crude is Up at 75.86.
Financials: The Mar '23 30 Year T-Bond is Down 48 ticks and trading at 128.09.
Indices: The Dec '22 S&P 500 Emini ES contract is 4 ticks Higher and trading at 3846.50.
Gold: The Feb'23 Gold contract is trading Up at 1816.17. Gold is 190 ticks Higher than its close.
Initial conclusion
This is not a correlated market. The dollar is Down, and Crude is Up which is normal, and the 30 Year T-Bond is trading Lower. The Financials should always correlate with the US dollar such that if the dollar is lower, then the bonds should follow and vice-versa. The S&P is Higher, and Crude is trading Higher which is not correlated. Gold is trading Higher which is correlated with the US dollar trading Down. I tend to believe that Gold has an inverse relationship with the US Dollar as when the US Dollar is down, Gold tends to rise in value and vice-versa. Think of it as a seesaw, when one is up the other should be down. I point this out to you to make you aware that when we don't have a correlated market, it means something is wrong. As traders you need to be aware of this and proceed with your eyes wide open. Currently all of Asia is trading Lower with the exception of the Sensex and Singapore exchanges. All of Europe is trading Higher. .
Possible challenges to traders today
-
Building Permits is out at 8:30 AM EST. Major.
-
Housing Starts are out at 8:30 AM EST. Major.
Treasuries
Traders, please note that we've changed the Bond instrument from the 30 year (ZB) to the 10 year (ZN). They work exactly the same.
We've elected to switch gears a bit and show correlation between the 10-year bond (ZN) and the S&P futures contract. The S&P contract is the Standard and Poor's, and the purpose is to show reverse correlation between the two instruments. Remember it's likened to a seesaw, when up goes up the other should go down and vice versa.
Yesterday the ZN hit a High at around 9:30 AM EST. The S&P was in an Upswing at around the same time. If you look at the charts below ZN gave a signal at around 9:30 AM and the S&P gave a signal at around the same time. Look at the charts below and you'll see a pattern for both assets. ZN hit a High at around 9:30 AM and continued its Downward trend. These charts represent the newest version of MultiCharts and I've changed the timeframe to a 15-minute chart to display better. This represented a Shorting opportunity on the 10-year note, as a trader you could have netted about 15 ticks per contract on this trade. Each tick is worth $15.625. Please note: the front month for the ZN is now Mar '23. The S&P contract is now Mar' 23 as well. I've changed the format to Renko Bars such that it may be more apparent and visible.
Charts courtesy of MultiCharts built on an AMP platform
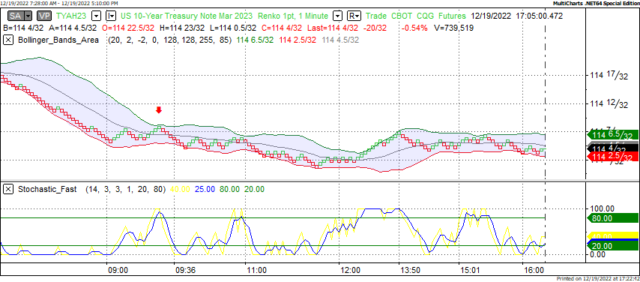
ZN - Mar 2023 - 12/19/22
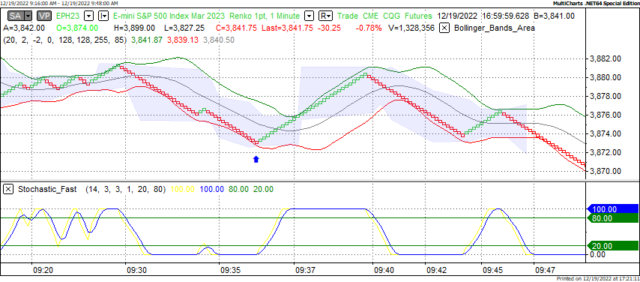
S&P - Dec 2022 - 12/19/22
Bias
Yesterday we gave the markets an Upside bias as it was correlated that way in the AM. The markets however had other ideas as the Dow dropped 163 points and the other indices lost ground as well. Today we aren't dealing with a correlated market and our bias is Neutral or Mixed.
Could this change? Of Course. Remember anything can happen in a volatile market.
Commentary
Yesterday we gave the markets an Upside bias as when we checked in the early AM, we saw correlation. Both the USD and the Bonds were trading Lower Monday morning and that usually reflects an Upside Day. The markets had other ideas and fell. Why? There are two reasons why this happened. First yesterday was the last session for the January 6th Commitee and the markets may have been spooked by what was said concerning the GOP and the former president. The other reason is the markets still don't like the Fed's stance on interest rates, inflation or unemployment. Certain Fed members have already stated a rise in unemployment next year and most folks aren't too excited about that.
Author

Nick Mastrandrea
Market Tea Leaves


