Downslide Continues [Video]
![Downslide Continues [Video]](https://editorial.fxstreet.com/images/Markets/Currencies/Majors/DollarIndex/financial-planning-calculator-closeup-1775995_XtraLarge.jpg)
US Dollar: March USD is Up at 96.440.
Energies: March '19 Crude is Down at 52.38.
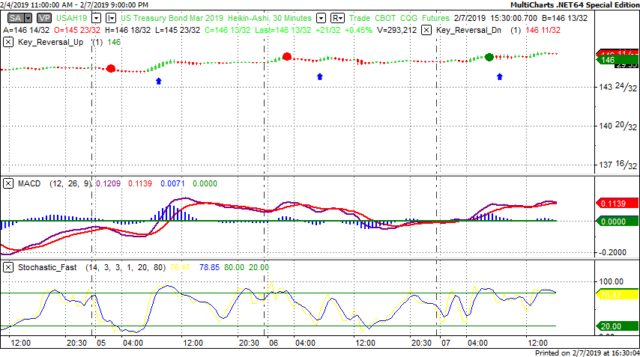
Financials: The Mar 30 year bond is Up 4 ticks and trading at 146.20.
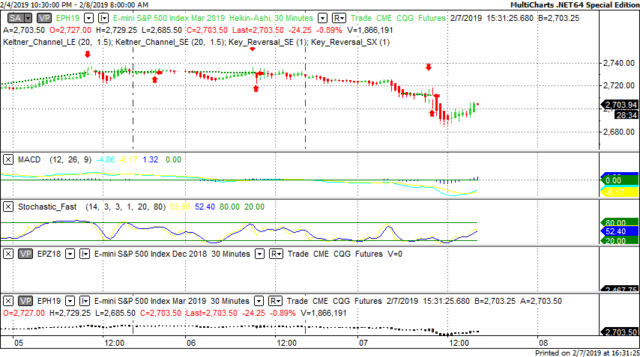
Indices: The Mar S&P 500 emini ES contract is 25 ticks Lower and trading at 2697.75.
Gold: The Feb Gold contract is trading Down at 1313.10. Gold is 11 ticks Lower than its close.
Initial Conclusion
This is not a correlated market. The dollar is Up+ and Crude is Down- which is normal and the 30 year Bond is trading Higher. The Financials should always correlate with the US dollar such that if the dollar is lower then bonds should follow and vice-versa. The S&P is Lower and Crude is trading Lower which is not correlated. Gold is trading Lower which is correlated with the US dollar trading Higher. I tend to believe that Gold has an inverse relationship with the US Dollar as when the US Dollar is down, Gold tends to rise in value and vice-versa. Think of it as a seesaw, when one is up the other should be down. I point this out to you to make you aware that when we don't have a correlated market, it means something is wrong. As traders you need to be aware of this and proceed with your eyes wide open.
At this hour Asia is trading Lower with the exception of the Shanghai exchange which is trading Higher at this time. Currently all of Europe is trading Higher at this time with the exception of the IBEX exchange which is Lower at this time.
Possible Challenges To Traders Today
-
No major economic news to speak of.
-
Lack of major economic news.
Treasuries
We've elected to switch gears a bit and show correlation between the 30 year bond (ZB) and The YM futures contract. The YM contract is the DJIA and the purpose is to show reverse correlation between the two instruments. Remember it's liken to a seesaw, when up goes up the other should go down and vice versa.
Yesterday the ZB made a major move at around 8 AM EST. The ZB hit a Low at around that time and the YM hit a High. If you look at the charts below ZB gave a signal at around 8 AM EST and the YM was moving Lower at the same time. Look at the charts below and you'll see a pattern for both assets. ZB hit a Low at around 8 AM and the YM was moving Lower at the same time. These charts represent the newest version of MultiCharts and I've changed the timeframe to a 30 minute chart to display better. This represented a Long opportunity on the 30 year bond, as a trader you could have netted about 18 ticks per contract on this trade. Each tick is worth $31.25. Please note: the front month for the ZB contract is now March, 2019
Charts Courtesy of MultiCharts built on an AMP platform.
Bias
Yesterday we gave the markets a Downside bias as both the USD and the Bonds were trading Higher yesterday morning and that doesn't bode well for an Upside day hence the Downside bias. The markets didn't disappoint as the Dow dropped 221 points and the other indices lost ground as well. Today we aren't dealing with a correlated market and our bias is to the Downside.
Could this change? Of Course. Remember anything can happen in a volatile market.
Commentary
Yesterday the analysts and pundits were talking about a global economic slowdown and the markets took heed of that. All of Europe traded to the Downside and the US markets followed. Today we have no major economic news to drive the markets one was or another, so traders will be doing more technical analysis as there won't be any fundamental news to determine market direction....
Author

Nick Mastrandrea
Market Tea Leaves


