Downside bias – Downside day [Video]
![Downside bias – Downside day [Video]](https://editorial.fxstreet.com/images/Markets/Currencies/Majors/DollarIndex/stock-market-analysis-1679764_XtraLarge.jpg)
US Dollar: Dec '20 USD Down at 93.705.
Energies: Nov'20 Crude is Down at 40.80.
Financials: The Dec '20 30 year bond is Up 5 ticks and trading at 175.13.
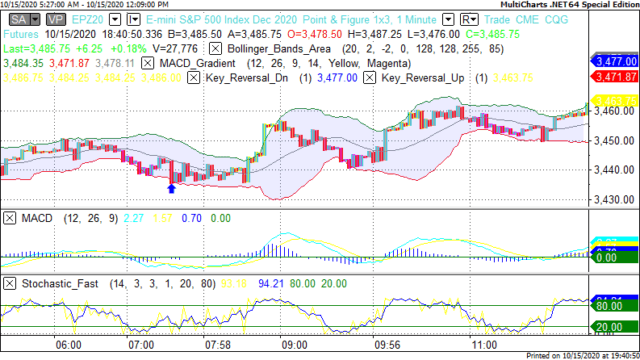
Indices: The Dec S&P 500 emini ES contract is 4 ticks Lower and trading at 3474.50.
Gold: The Dec'20 Gold contract is trading Up at 1912.50 Gold is 35 ticks Higher than its close.
Initial Conclusion
This is not a correlated market. The dollar is Down- and Crude is Down- which is not normal and the 30 year Bond is trading Higher. The Financials should always correlate with the US dollar such that if the dollar is lower then bonds should follow and vice-versa. The S&P is Lower (fractionally) and Crude is trading Lower which is not correlated. Gold is trading Higher which is correlated with the US dollar trading Down. I tend to believe that Gold has an inverse relationship with the US Dollar as when the US Dollar is down, Gold tends to rise in value and vice-versa. Think of it as a seesaw, when one is up the other should be down. I point this out to you to make you aware that when we don't have a correlated market, it means something is wrong. As traders you need to be aware of this and proceed with your eyes wide open.
All of Asia traded Higher with the exception of the Japanese Nikkei exchange which traded Lower. All of Europe is trading Higher at this time with the exception of the Spanish IBEX exchange which is Lower at this time.
Possible Challenges To Traders Today
-
Core Retail Sales m/m is out at 8:30 AM EST. This is Major.
-
Retail Sales is out at 8:30 AM EST. This is Major.
-
Capacity Utilization Rate is out at 9:15 AM EST. Major.
-
Industrial Production m/m is out at 9:15 AM EST. Major.
-
Prelim UoM Consumer Sentiment is out at 10 AM EST. This is Major.
-
Prelim UoM Inflation Expectations is out at 10 AM EST. Major.
-
Business Inventories m/m at 10 AM EST. This is Major.
-
FOMC Member Quarles Speaks at 11 AM EST. This is Major.
Treasuries
Traders please note that we've changed the Bond instrument from the 30 year (ZB) to the 10 year (ZN). They work exactly the same.
We've elected to switch gears a bit and show correlation between the 10 year bond (ZN) and The S&P futures contract. The S&P contract is the Standard and Poor's and the purpose is to show reverse correlation between the two instruments. Remember it's liken to a seesaw, when up goes up the other should go down and vice versa.
Yesterday the ZN made it's move at around 7:30 AM EST. The ZN hit a High at around that time and the S&P moved Higher. If you look at the charts below ZN gave a signal at around 7:30 AM EST and the S&P moved Higher at around the same time. Look at the charts below and you'll see a pattern for both assets. ZN hit a High at around 7:30 AM EST and the S&P was moving Higher shortly thereafter. These charts represent the newest version of MultiCharts and I've changed the timeframe to a 15 minute chart to display better. This represented a Shorting opportunity on the 10 year note, as a trader you could have netted about 20 ticks per contract on this trade. Each tick is worth $15.625. Please note: the front month for the ZN is now Dec '20. The S&P contract is also Dec '20 as well. I've changed the format to Renko bars such that it may be more apparent and visible.
Charts Courtesy of MultiCharts built on an AMP platform

Bias
Yesterday we gave the markets a Downside bias as the USD and the Bonds were trading Higher yesterday morning and this is indicative of a Downside day. The markets didn't disappoint as the Dow dropped 20 points and the other indices lost ground as well. Today we aren't dealing with a correlated market and our bias is Neutral.
Could this change? Of Course. Remember anything can happen in a volatile market.
Commentary
Yesterday we had economic news that wasn't exactly stellar and I think the markets took that as a sign that things are not as rosy as people think. We had initial Unemployment claims come in at 900,000 and this is not going in the right direction. Empire State Manufacturing is Down. These aren't signs that the economy is getting better. I've long said that once Corporate America sees how much money they're saving in labor costs, they will become very creative in terms of not hiring and bringing those jobs back. So this notion of a V shaped, U shaped recovery is nil at best.
Author

Nick Mastrandrea
Market Tea Leaves


