Good Morning Traders,

As of this writing 4 AM EST, here’s what we see:

US Dollar: Sept USD is Down at 97.065.
Energies:
July '19 Crude is Down at 52.28.
Financials:
The Sept 30 year bond is Down 4 ticks and trading at 154.07.
Indices:
The June S&P 500 emini ES contract is 14 ticks Higher and trading at 2894.00.
Gold: The June Gold contract is trading Down at 1338,40. Gold is 60 ticks Lower than its close.

Initial Conclusion

This is not a correlated market. The dollar is Down- and Crude is Down- which is not normal and the 30 year Bond is trading Lower. The Financials should always correlate with the US dollar such that if the dollar is lower then bonds should follow and vice-versa. The S&P is Higher and Crude is trading Lower which is correlated. Gold is trading Lower which is not correlated with the US dollar trading Down. I tend to believe that Gold has an inverse relationship with the US Dollar as when the US Dollar is down, Gold tends to rise in value and vice-versa. Think of it as a seesaw, when one is up the other should be down. I point this out to you to make you aware that when we don't have a correlated market, it means something is wrong. As traders you need to be aware of this and proceed with your eyes wide open.

Asia traded Mixed and Europe is trading Mixed as well at this time.

Possible Challenges To Traders Today

  • Empire State Manufacturing Index is out at 8:30 AM EST. This is major.

  • NAHB Housing Market Index is out at 10 AM EST. This is major.

  • TIC Long-Term Purchases is out at 4 PM EST. This will have no effect on this session.

 Treasuries

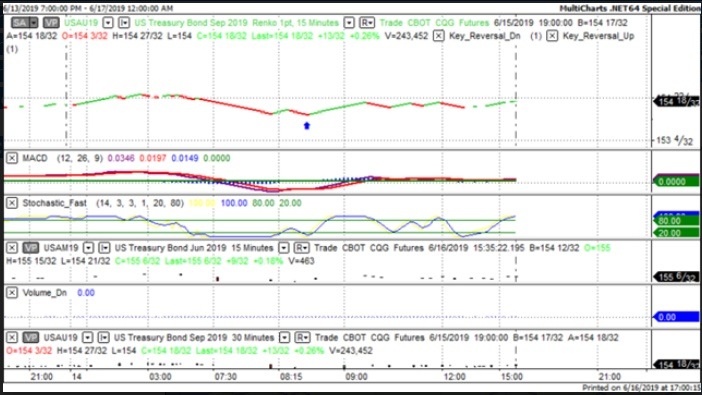
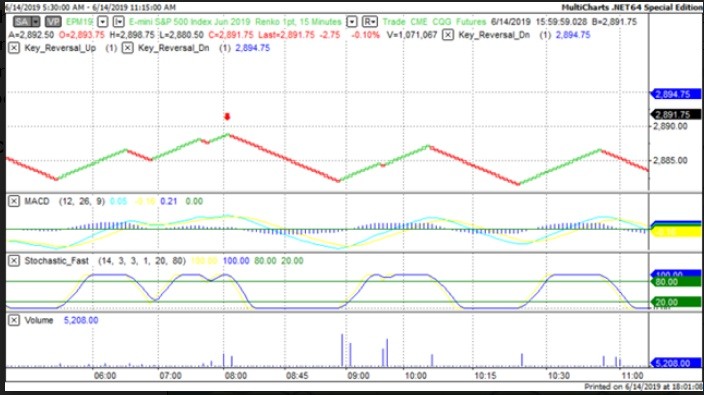
We've elected to switch gears a bit and show correlation between the 30 year bond (ZB) and The YM futures contract. The YM contract is the DJIA and the purpose is to show reverse correlation between the two instruments. Remember it's liken to a seesaw, when up goes up the other should go down and vice versa.

On Friday the ZB made a major move at around 8:30 AM EST. The ZB hit a Low at around that time and the YM hit a High. If you look at the charts below ZB gave a signal at around 8:30 AM EST and the YM was moving Lower at the same time. Look at the charts below and you'll see a pattern for both assets. ZB hit a Low at around 8:30 AM and the YM was moving Lower at the same time. These charts represent the newest version of MultiCharts and I've changed the timeframe to a 15 minute chart to display better. This represented a Long opportunity on the 30 year bond, as a trader you could have netted about 17 ticks per contract on this trade. Each tick is worth $31.25. Please note: the front month for the ZB contract is now September, 2019 and I've changed the format to Renko bars such that it may be more apparent and visible.

Charts Courtesy of MultiCharts built on an AMP platform.

Tea


Tea


Bias

On Friday we gave the markets a Downside bias as the USD, Bonds and Gold were all pointing Higher Friday morning and that does not bode well for an Upside day, hence the Downside bias. The markets didn't disappoint as the Dow dropped 17 points and the other indices lost ground as well. Today we aren't dealing with a correlated market however our bias is to the Upside.

Could this change? Of Course. Remember anything can happen in a volatile market.

Commentary

It appears as though Secretary of State Mike Pompeo is sticking to the idea that Iran was behind the two oil tanker "attacks" last week even though he has no solid proof or evidence to establish such a claim. He is claiming that Saudi Arabia says that Iran is the culprit yet they have no solid evidence either. Pompeo is calling leaders from around the world to coerce them to say that Iran is at fault, but once again no proof. It's not like we haven't seen this kind of movie before. We saw it in 2002 and 2003 when the Bush Administration tried so hard to make the world believe that Iraq had WMD's but once again no real, solid evidence.

Trading performance displayed herein is hypothetical. The following Commodity Futures Trading Commission (CFTC) disclaimer should be noted.

Hypothetical performance results have many inherent limitations, some of which are described below. No representation is being made that any account will or is likely to achieve profits or losses similar to those shown.

In fact, there are frequently sharp differences between hypothetical performance results and the actual results subsequently achieved by any particular trading program. One of the limitations of hypothetical performance trading results is that they are generally prepared with the benefit of hindsight.

In addition, hypothetical trading does not involve financial risk, and no hypothetical trading record can completely account for the impact of financial risk in actual trading. For example, the ability to withstand losses or to adhere to a particular trading program in spite of trading losses are material points which can also adversely affect actual trading results.

There are numerous other factors related to the markets in general or to the implementation of any specific trading program which cannot be fully accounted for in the preparation of hypothetical performance results and all of which can adversely affect actual trading results.

Trading in the commodities markets involves substantial risk and YOU CAN LOSE A LOT OF MONEY, and thus is not appropriate for everyone. You should carefully consider your financial condition before trading in these markets, and only risk capital should be used.

In addition, these markets are often liquid, making it difficult to execute orders at desired prices. Also, during periods of extreme volatility, trading in these markets may be halted due to so-called “circuit breakers” put in place by the CME to alleviate such volatility. In the event of a trading halt, it may be difficult or impossible to exit a losing position.

Recommended Content


Recommended Content

Editors’ Picks

AUD/USD hovers around 0.6500 amid light trading, ahead of US GDP

AUD/USD hovers around 0.6500 amid light trading, ahead of US GDP

AUD/USD is trading close to 0.6500 in Asian trading on Thursday, lacking a clear directional impetus amid an Anzac Day holiday in Australia. Meanwhile, traders stay cautious due ti risk-aversion and ahead of the key US Q1 GDP release. 

AUD/USD News

USD/JPY finds its highest bids since 1990, near 155.50

USD/JPY finds its highest bids since 1990, near 155.50

USD/JPY keeps breaking into its highest chart territory since June of 1990 early Thursday, testing 155.50 for the first time in 34 years as the Japanese Yen remains vulnerable, despite looming Japanese intervention risks. Focus shifts to Thursday's US GDP report and the BoJ decision on Friday. 

USD/JPY News

Gold price treads water near $2,320, awaits US GDP data

Gold price treads water near $2,320, awaits US GDP data

Gold price recovers losses but keeps its range near $2,320 early Thursday. Renewed weakness in the US Dollar and the US Treasury yields allow Gold buyers to breathe a sigh of relief. Gold price stays vulnerable amid Middle East de-escalation, awaiting US Q1 GDP data. 

Gold News

Injective price weakness persists despite over 5.9 million INJ tokens burned

Injective price weakness persists despite over 5.9 million INJ tokens burned

Injective price is trading with a bearish bias, stuck in the lower section of the market range. The bearish outlook abounds despite the network's deflationary efforts to pump the price. Coupled with broader market gloom, INJ token’s doomed days may not be over yet.

Read more

Meta Platforms Earnings: META sinks 10% on lower Q2 revenue guidance Premium

Meta Platforms Earnings: META sinks 10% on lower Q2 revenue guidance

This must be "opposites" week. While Doppelganger Tesla rode horrible misses on Tuesday to a double-digit rally, Meta Platforms produced impressive beats above Wall Street consensus after the close on Wednesday, only to watch the share price collapse by nearly 10%.

Read more

Majors

Cryptocurrencies

Signatures