US Dollar: Dec. USD is Up at 95.375.

Energies: Oct '18 Crude is Down at 74.64.

Financials: The Dec 30 year bond is Down 9 ticks and trading at 137.14.

Indices: The Dec S&P 500 emini ES contract is 18 ticks Lower and trading at 2883.50.

Gold: The Dec Gold contract is trading Down at 1190.20. Gold is 13 ticks Lower than its close.

Initial Conclusion

This is not a correlated market.  The dollar is Up+ and Crude is Down-  which is normal but the 30 year Bond is trading Lower.  The Financials should always correlate with the US dollar such that if the dollar is lower then bonds should follow and vice-versa. The S&P is Lower and Crude is trading Lower which is not correlated. Gold is trading Down- which is correlated with the US dollar trading Higher.   I tend to believe that Gold has an inverse relationship with the US Dollar as when the US Dollar is down, Gold tends to rise in value and vice-versa. Think of it as a seesaw, when one is up the other should be down. I point this out to you to make you aware that when we don't have a correlated market, it means something is wrong. As traders you need to be aware of this and proceed with your eyes wide open.

At this hour Asia is trading mainly Higher with the exception of the Aussie and Singapore exchanges which are Lower. Currently all of Europe is trading Lower.

Possible Challenges To Traders Today

  • PPI m/m is out at 8:30 AM EST.  Major.

  • Core PPI m/m is out at 8:30 AM EST.  Major.

  • Final Wholesale Inventories is out at 10 AM EST.  Major.

  • 10-y Bond Auction starts at 1 PM EST.  This is major.

  • Treasury Currency Report - tentative

 Treasuries

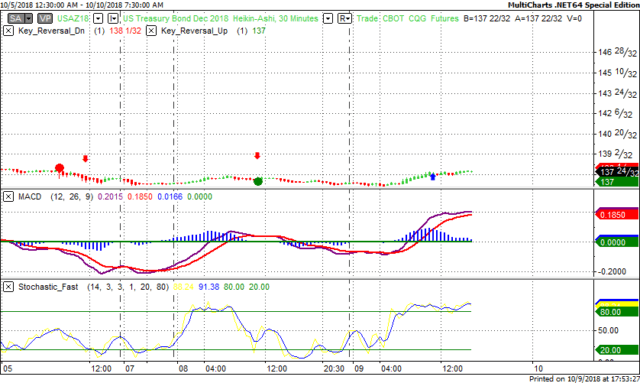
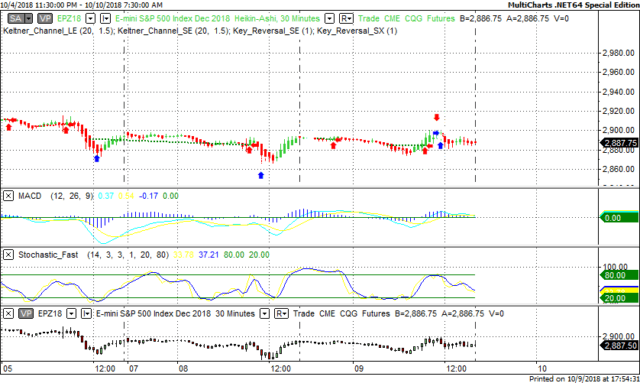
We've elected to switch gears a bit and show correlation between the 30 year bond (ZB) and The YM futures contract.  The YM contract is the DJIA and the purpose is to show reverse correlation between the two instruments.  Remember it's liken to a seesaw, when up goes up the other should go down and vice versa.

Yesterday the ZB made it's move at around 11:30 AM EST.  The ZB hit a Low at around that time and the YM hit a High.  If you look at the charts below ZB gave a signal at around 11:30 AM EST and the YM was moving Lower at the same time. Look at the charts below and you'll see a pattern for both assets. ZB hit a Low at around 11:30 AM and the YM was moving Lower at the same time.  These charts represent the newest version of MultiCharts and I've changed the timeframe to a 30 minute chart to display better.  This represented a Long opportunity on the 30 year bond, as a trader you could have netted about a dozen ticks per contract on this trade.  Each tick is worth $31.25.

Charts Courtesy of MultiCharts built on an AMP platform.

ZB


YM

Bias

Yesterday we gave the markets a Downside bias as Gold, Crude and the USD were all pointed Higher yesterday morning and this bodes well for a Downside day.  The Dow dropped 56 points, the S&P lost 4 and the Nasdaq gained 2.  Today we aren't dealing with a correlated market and our bias is Neutral.

Could this change? Of Course. Remember anything can happen in a volatile market. 

Commentary

Yesterday morning Gold, the USD and Crude were all trading Higher and this usually reflects a Downside day.  The markets didn't disappoint as they dropped during the session with only the Nasdaq showing a slight gain.  Today we have PPI which is major and a proven market mover.  Why? Because the Federal Reserve uses this number ( along with CPI) to determine if inflation is forthcoming or benign.

Trading performance displayed herein is hypothetical. The following Commodity Futures Trading Commission (CFTC) disclaimer should be noted.

Hypothetical performance results have many inherent limitations, some of which are described below. No representation is being made that any account will or is likely to achieve profits or losses similar to those shown.

In fact, there are frequently sharp differences between hypothetical performance results and the actual results subsequently achieved by any particular trading program. One of the limitations of hypothetical performance trading results is that they are generally prepared with the benefit of hindsight.

In addition, hypothetical trading does not involve financial risk, and no hypothetical trading record can completely account for the impact of financial risk in actual trading. For example, the ability to withstand losses or to adhere to a particular trading program in spite of trading losses are material points which can also adversely affect actual trading results.

There are numerous other factors related to the markets in general or to the implementation of any specific trading program which cannot be fully accounted for in the preparation of hypothetical performance results and all of which can adversely affect actual trading results.

Trading in the commodities markets involves substantial risk and YOU CAN LOSE A LOT OF MONEY, and thus is not appropriate for everyone. You should carefully consider your financial condition before trading in these markets, and only risk capital should be used.

In addition, these markets are often liquid, making it difficult to execute orders at desired prices. Also, during periods of extreme volatility, trading in these markets may be halted due to so-called “circuit breakers” put in place by the CME to alleviate such volatility. In the event of a trading halt, it may be difficult or impossible to exit a losing position.

Recommended Content


Recommended Content

Editors’ Picks

EUR/USD climbs to 10-day highs above 1.0700

EUR/USD climbs to 10-day highs above 1.0700

EUR/USD gained traction and rose to its highest level in over a week above 1.0700 in the American session on Tuesday. The renewed US Dollar weakness following the disappointing PMI data helps the pair stretch higher.

EUR/USD News

GBP/USD extends recovery beyond 1.2400 on broad USD weakness

GBP/USD extends recovery beyond 1.2400 on broad USD weakness

GBP/USD gathered bullish momentum and extended its daily rebound toward 1.2450 in the second half of the day. The US Dollar came under heavy selling pressure after weaker-than-forecast PMI data and fueled the pair's rally. 

GBP/USD News

Gold rebounds to $2,320 as US yields turn south

Gold rebounds to $2,320 as US yields turn south

Gold reversed its direction and rose to the $2,320 area, erasing a large portion of its daily losses in the process. The benchmark 10-year US Treasury bond yield stays in the red below 4.6% following the weak US PMI data and supports XAU/USD.

Gold News

Here’s why Ondo price hit new ATH amid bearish market outlook Premium

Here’s why Ondo price hit new ATH amid bearish market outlook

Ondo price shows no signs of slowing down after setting up an all-time high (ATH) at $1.05 on March 31. This development is likely to be followed by a correction and ATH but not necessarily in that order.

Read more

Germany’s economic come back

Germany’s economic come back

Germany is the sick man of Europe no more. Thanks to its service sector, it now appears that it will exit recession, and the economic future could be bright. The PMI data for April surprised on the upside for Germany, led by the service sector.

Read more

Majors

Cryptocurrencies

Signatures