Downside Bias = Downside Day

US Dollar: Dec. USD is Up at 93.625.
Energies: Jan ’18 Crude is Up at 56.12.
Financials: The Mar 30 year bond is Down 4 ticks and trading at 153.30.
Indices: The Dec S&P 500 emini ES contract is 10 ticks Higher and trading at 2631.75.
Gold: The Feb gold contract is trading Down at 1259.40. Gold is 66 ticks Lower than its close.
Initial Conclusion
This is not a correlated market. The dollar is Up+ and Crude is Up+ which is not normal but the 30 year Bond is trading Lower. The Financials should always correlate with the US dollar such that if the dollar is lower then bonds should follow and vice-versa. The indices are Higher and Crude is trading Up+ which is not correlated. Gold is trading Down- which is correlated with the US dollar trading Up+. I tend to believe that Gold has an inverse relationship with the US Dollar as when the US Dollar is down, Gold tends to rise in value and vice-versa. Think of it as a seesaw, when one is up the other should be down. I point this out to you to make you aware that when we don’t have a correlated market, it means something is wrong. As traders you need to be aware of this and proceed with your eyes wide open.
At this hour Asia is trading mainly Higher with the exception of the Shanghai and Singapore exchanges which are Lower at this hour. As of this writing all of Europe is trading Higher.
Possible Challenges To Traders Today
-
Challenger Job Cuts y/y is out at 7:30 AM EST. This is major.
-
Unemployment Claims is out at 8:30 AM EST. This is major.
-
Natural Gas Storage is out at 10:30 AM EST. This is major.
-
Consumer Credit m/m is out at 3 PM EST. This is major.
Treasuries
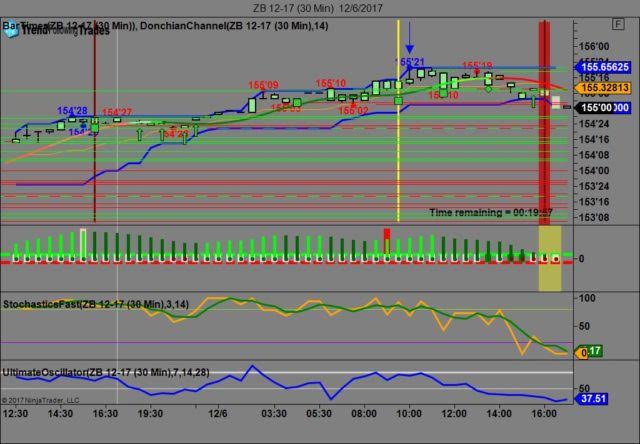
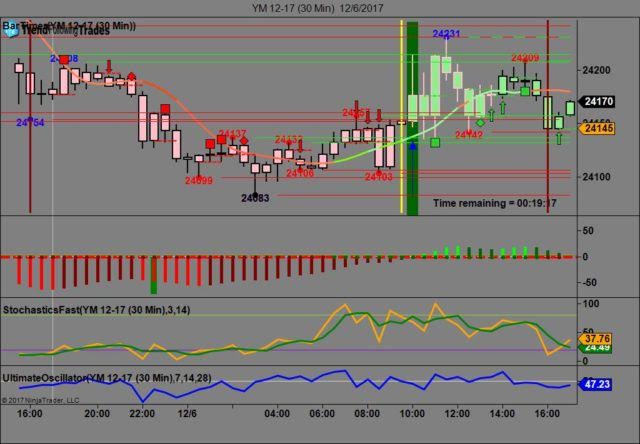
We’ve elected to switch gears a bit and show correlation between the 30 year bond (ZB) and The YM futures contract. The YM contract is the DJIA and the purpose is to show reverse correlation between the two instruments. Remember it’s liken to a seesaw, when up goes up the other should go down and vice versa.
Yesterday the ZB made it’s move at around 10 AM EST. The ZB hit a High at around that time and the YM hit a Low. If you look at the charts below ZB gave a signal at around 10 AM EST and the YM was moving Higher at the same time. Look at the charts below and you’ll see a pattern for both assets. ZB hit a High at around 10 AM and the YM hit a Low. These charts represent the newest version of Trend Following Trades and I’ve changed the timeframe to a 30 minute chart to display better. This represented a long opportunity on the 30 year bond, as a trader you could have netted about a dozen plus ticks per contract on this trade. Each tick is worth $31.25. We added a Donchian Channel to the charts to show the signals more clearly.
Charts Courtesy of Trend Following Trades built on a NinjaTrader platform.
Bias
Yesterday we gave the markets a Downside bias as the Bonds and Gold were trading higher Wednesday morning and this usually bodes well for a downside day. The markets didn’t disappoint as the Dow dropped 40 points, the S&P gained about a point but the Nasdaq gained about 14 points. Today we aren’t dealing with a correlated market however our bias is to the Upside.
Could this change? Of Course. Remember anything can happen in a volatile market.
Commentary
The economic news reported yesterday was ok, not great or stellar mind you but ok. The problem with ok reports is the markets expect more and when they don’t get it or see it, the markets falter. This is pretty much what happened yesterday. Now subscribers knew this after 4 AM yesterday morning when we release our latest edition. From our perspective all we did was to stick to our rules of market correlation. Today we have Challenger Jobs Cuts which may provide some insight on tomorrow’s Non Farm Payroll numbers, but as in all things time will tell….
Author

Nick Mastrandrea
Market Tea Leaves


