We get a market that does what it should do

USD: Sep '23 is Up at 106.000.
Energies: Oct '23 Crude is Up at 91.79.
Financials: The Dec '23 30 Year T-Bond is Up 29 ticks and trading at 105.09.
Indices: The Dec '23 S&P 500 emini ES contract is 51 ticks Higher and trading at 4327.50.
Gold: The Dec'23 Gold contract is trading Down at 1913.50.
Initial conclusion
This is not a correlated market. The USD is Up and Crude is Up which is not normal, and the 30 Year T-Bond is trading Higher. The Financials should always correlate with the US dollar such that if the dollar is Higher, then the bonds should follow and vice-versa. The S&P is Higher, and Crude is trading Higher which is not correlated. Gold is trading Lower which is correlated with the US dollar trading Up. I tend to believe that Gold has an inverse relationship with the US Dollar as when the US Dollar is down, Gold tends to rise in value and vice-versa. Think of it as a seesaw, when one is up the other should be down. I point this out to you to make you aware that when we don't have a correlated market, it means something is wrong. As traders you need to be aware of this and proceed with your eyes wide open. All of Asia is trading Higher with the exception of the Singapore exchange which is Lower. Currently all of Europe is trading Lower with the exception of the Spanish IBEX exchange.
Possible challenges to traders
-
Core Durable Goods Orders m/m is out at 8:30 AM EST. This is Major.
-
Durable Goods Orders m/m is out at 8:30 AM EST. This is Major.
-
Crude Oil Inventories are out at 10:30 AM EST. This is Major.
Treasuries
Traders, please note that we've changed the Bond instrument from the 30 year (ZB) to the 10 year (ZN). They work exactly the same.
We've elected to switch gears a bit and show correlation between the 10-year bond (ZN) and the S&P futures contract. The S&P contract is the Standard and Poor's, and the purpose is to show reverse correlation between the two instruments. Remember it's likened to a seesaw, when up goes up the other should go down and vice versa.
Yesterday the ZN migrated Higher at around 9:45 AM EST as the S&P hit a High at around the same time. If you look at the charts below the S&P gave a signal at around 9:45 AM and the ZN started its Upward ascend. Look at the charts below and you'll see a pattern for both assets. S&P hit a High at around 9:45 AM and migrated Lower. These charts represent the newest version of MultiCharts and I've changed the timeframe to a 15-minute chart to display better. This represented a Long opportunity on the 10-year note, as a trader you could have netted about 10 ticks per contract on this trade. Each tick is worth $15.625. Please note: the front month for the ZN is now Dec '23. The S&P contract is now Dec' 23. I've changed the format to filled Candlesticks (not hollow) such that it may be more apparent and visible.
Charts courtesy of MultiCharts built on an AMP platform
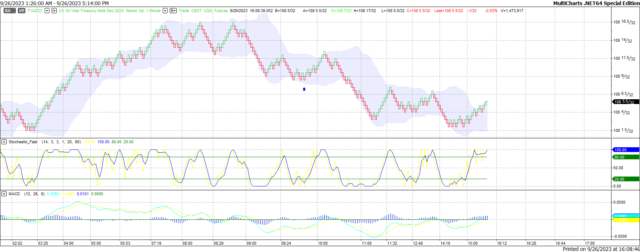
ZN - Dec 2023 - 9/26/23
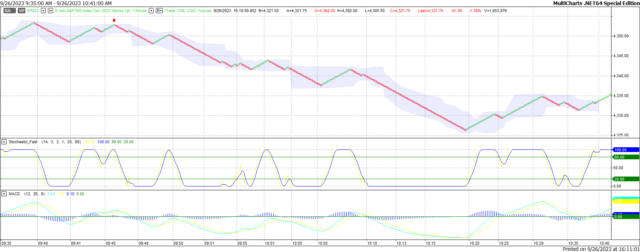
S&P - Dec 2023 - 9/26/23
Bias
Yesterday, we gave the markets a Downside bias as all indications were for a Down Day. The markets didn't disappoint as the Dow dropped 388 points and the other indices traded Lower as well. Today we aren't dealing with a correlated market and our bias is Neutral.
Could this change? Of Course. Remember anything can happen in a volatile market.
Commentary
Finally, we get a market that does what it should do. All indications were for a Down Day yesterday and the markets didn't disappoint. Could it be the combination of a looming government shutdown and the auto workers strike helped to drag the markets down. Readers of this newsletter knew that hours before the markets opened. Today we have the critical Durable Goods and Core Durable Goods out at 8:30 AM EST. This is used by the Fed as a bellwether on how the economy is doing. No doubt the Fed will use this as part of their criteria on interest rates.
Author

Nick Mastrandrea
Market Tea Leaves


