Dow Up….slightly

Good Morning Traders,
As of this writing 4 AM EST, here’s what we see:
US Dollar: Jun. USD is Up at 93.930.
Energies: Jun '18 Crude is Up at 71.73.
Financials: The June 30 year bond is Up 2 ticks and trading at 141.08.
Indices: The June S&P 500 emini ES contract is 56 ticks Higher and trading at 2727.00.
Gold: The June gold contract is trading Down at 1282.40. Gold is 89 ticks Lower than its close.
Initial Conclusion
This is not a correlated market. The dollar is Up+ and Crude is Up+ which is not normal and the 30 year Bond is trading Higher. The Financials should always correlate with the US dollar such that if the dollar is lower then bonds should follow and vice-versa. The S&P is Higher and Crude is trading Higher which is not correlated. Gold is trading Down- which is correlated with the US dollar trading Up+. I tend to believe that Gold has an inverse relationship with the US Dollar as when the US Dollar is down, Gold tends to rise in value and vice-versa. Think of it as a seesaw, when one is up the other should be down. I point this out to you to make you aware that when we don't have a correlated market, it means something is wrong. As traders you need to be aware of this and proceed with your eyes wide open.
At this hour Asia is trading mainly Higher with the exception of the Aussie and Sensex exchanges which are Lower. Most of Europe is closed for a bank holiday.
Possible Challenges To Traders Today
-
European markets are closed for Whit Monday.
-
FOMC Member Bostic Speaks at 11:30 AM. This is major.
Treasuries
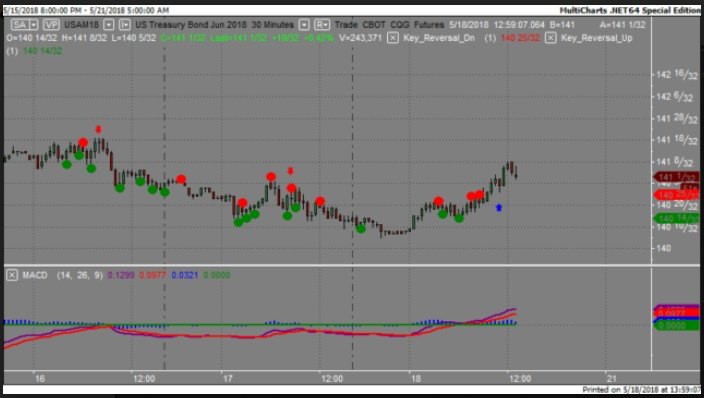
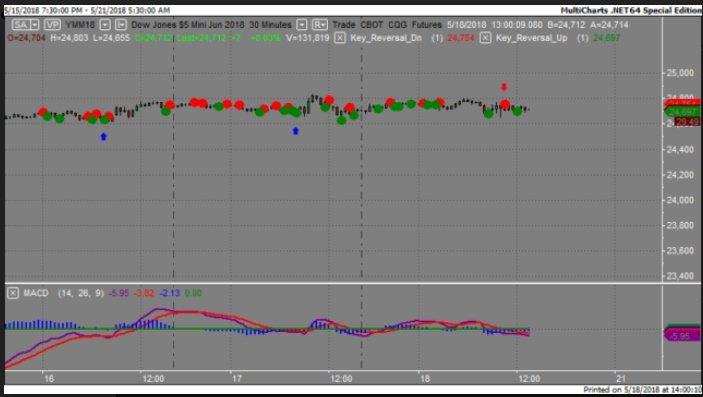
We've elected to switch gears a bit and show correlation between the 30 year bond (ZB) and The YM futures contract. The YM contract is the DJIA and the purpose is to show reverse correlation between the two instruments. Remember it's liken to a seesaw, when up goes up the other should go down and vice versa.
Yesterday the ZB made it's move at around 10:30 AM EST. The ZB hit a Low at around that time and the YM hit a High. If you look at the charts below ZB gave a signal at around 10:30 AM EST and the YM was moving Lower at the same time. Look at the charts below and you'll see a pattern for both assets. ZB hit a Low at around 10:30 AM and the YM was trending Lower at the same time. These charts represent the newest version of MultiCharts and I've changed the timeframe to a 30 minute chart to display better. This represented a long opportunity on the 30 year bond, as a trader you could have netted about 15 ticks per contract on this trade. Each tick is worth $31.25.
Charts Courtesy of MultiCharts built on an AMP platform.
Bias
On Friday we gave the markets an Upside bias as the USD and Gold were both trading lower Friday morning. The Dow did advance by 1 point Friday but the other indices lost ground slightly. Today we aren't dealing with a correlated market and our bias is to the Upside.
Could this change? Of Course. Remember anything can happen in a volatile market.
Commentary
On Friday we only had one economic report to speak of and that was an FOMC member speaking, other than that nothing. The Dow did gain slightly by only 1 point but the S&P dropped 7 and the Nasdaq 28 points. Today we only have another FOMC Member speaking at 11:30 AM EST but the European markets are closed today for a bank holiday. All in all the markets will have to fend for itself today as there isn't any economic news that could move it in one direction or another. Something to be mindful of if trading.
Author

Nick Mastrandrea
Market Tea Leaves


