Dow Up, Others Down again

Good Morning Traders,
As of this writing 4:10 AM EST, here’s what we see:
US Dollar: Sept. USD is Up at 93.350.
Energies: Sept Crude is Up at 49.90.
Financials: The Sept 30 year bond is Down 2 ticks and trading at 153.04.
Indices: The Sept S&P 500 emini ES contract is 10 ticks Higher and trading at 2472.75.
Gold: The Aug gold contract is trading Down at 1272.50. Gold is 28 ticks Lower than its close.
Initial Conclusion
This is not a correlated market. The dollar is Up+ and Crude is Up+ which is not normal but the 30 year Bond is trading Lower. The Financials should always correlate with the US dollar such that if the dollar is lower then bonds should follow and vice-versa. The indices are Up+ and Crude is trading Up+ which is not correlated. Gold is trading Down- which is correlated with the US dollar trading Up+-. I tend to believe that Gold has an inverse relationship with the US Dollar as when the US Dollar is down, Gold tends to rise in value and vice-versa. Think of it as a seesaw, when one is up the other should be down. I point this out to you to make you aware that when we don’t have a correlated market, it means something is wrong. As traders you need to be aware of this and proceed with your eyes wide open.
At this hour all of Asia is trading to the Upside with the exception of the Nikkei exchange which is trading down. As of this broadcast all of Europe is trading Higher.
Possible Challenges To Traders Today
– Chicago PMI is out at 9:45 AM EST. This is major.
– Pending Home Sales is out at 10 AM EST. This is major.
Treasuries
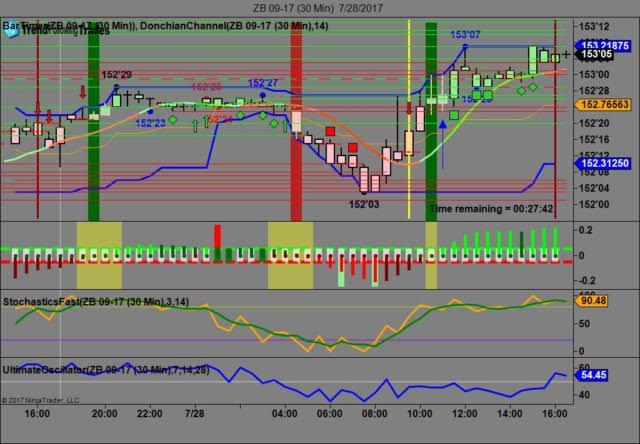
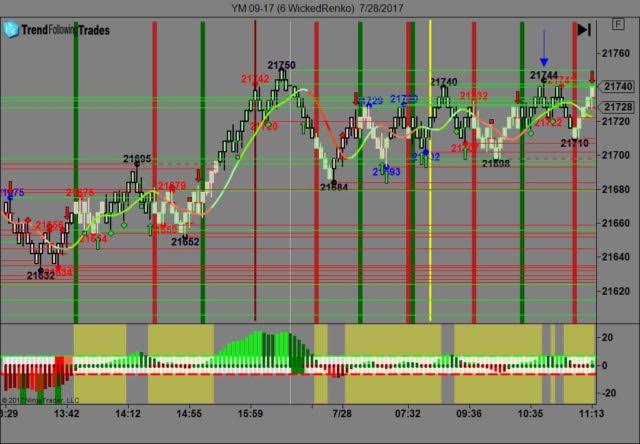
We’ve elected to switch gears a bit and show correlation between the 30 year bond (ZB) and The YM futures contract. The YM contract is the DJIA and the purpose is to show reverse correlation between the two instruments. Remember it’s liken to a seesaw, when up goes up the other should go down and vice versa.
On Friday the ZB made it’s move at around 11 AM EST after the economic news was reported. The ZB hit a low at around that time and the YM hit a High. If you look at the charts below ZB gave a signal at around 11 AM and the YM was moving Lower at the same time. Look at the charts below and you’ll see a pattern for both assets. ZB hit a Low at around 11 AM and the YM hit a High. These charts represent the newest version of Trend Following Trades and I’ve changed the timeframe to a 30 minute chart to display better. This represented a shorting opportunity on the 30 year bond, as a trader you could have netted about 15 ticks per contract on this trade. Each tick is worth $31.25. We added a Donchian Channel to the charts to show the signals more clearly. Please note that the front month for the ZB contract is now September, 2017.
Charts Courtesy of Trend Following Trades built on a NinjaTrader platform.
Bias
On Friday we gave the markets a neutral bias as the USD, Crude and Gold were all pointed lower however the indices were trading Lower. In theory they should have been trading higher. The Dow closed higher by 34 points however the other indices lost ground. Today we aren’t dealing with a correlated market and bias is to the Upside.
Could this change? Of Course. Remember anything can happen in a volatile market.
Commentary
On Friday the markets learned that the Senate had shot down “skinny” Obamacare that would have repealed the ACA but provided no replacement. Of course DC is now playing the blame game as the House is blaming the Senate and Speaker Ryan is now claiming that the House is the only branch of government doing it’s job. So I guess throwing millions off healthcare with no replacement or alternative is “doing your job”. Interesting. In any case the markets didn’t like this news and GDP came in at 2.0% where its been for years now and I suppose the Smart Money didn’t like that either. Today we have Chicago PMI and Pending Home Sales; both of which are major and proven market movers.
Author

Nick Mastrandrea
Market Tea Leaves
Nick Mastrandrea over 20 years experience in trading and formerly held a NASD Series 7. He currently holds a NJ Life, Health and Variable Authority. Nick is a published writer and his work has appeared in Futures Magazine, TraderPlanet and others.


