Dow Taps 20,000
Good Morning Traders,
As of this writing 3:50 AM EST, here’s what we see:
US Dollar: Mar. USD is Up at 102.220.
Energies: February Crude is Down at 53.72.
Financials: The Mar 30 year bond is Up 3 ticks and trading at 151.28.
Indices: The March S&P 500 emini ES contract is 7 ticks Higher and trading at 2273.25.
Gold: The February gold contract is trading Up at 1176.80. Gold is 34 ticks Higher than its close.
Initial Conclusion
This is not a correlated market. The dollar is Up+ and crude is Down- which is normal and the 30 year bond is trading Up+. The Financials should always correlate with the US dollar such that if the dollar is lower then bonds should follow and vice-versa. The indices are Up+ and Crude is trading Down- which is correlated. Gold is trading Up which is not correlated with the US dollar trading Up. I tend to believe that Gold has an inverse relationship with the US Dollar as when the US Dollar is down, Gold tends to rise in value and vice-versa. Think of it as a seesaw, when one is up the other should be down. I point this out to you to make you aware that when we don’t have a correlated market, it means something is wrong. As traders you need to be aware of this and proceed with your eyes wide open.
Asia traded mainly higher with the exception of the Aussie and Nikkei exchanges which traded lower. As of this writing Europe is trading mainly lower with the exception of the London and Milan exchanges are are trading higher at this hour.
Possible Challenges To Traders Today
– Labor Market Conditions Index is out at 10 AM. This is not major.
– Consumer Credit m/m is out at 3 PM EST. This is major.
Treasuries
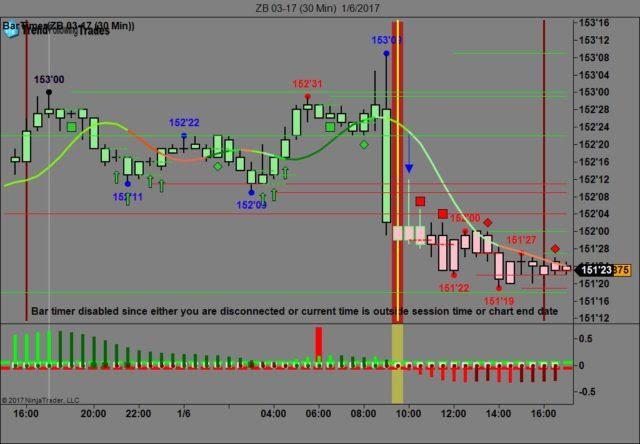
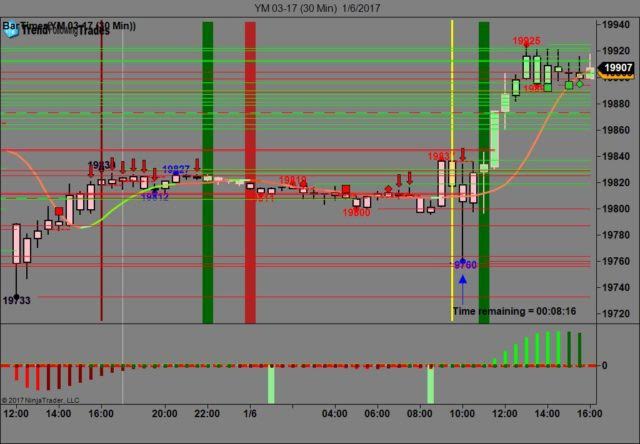
We’ve elected to switch gears a bit and show correlation between the 30 year bond (ZB) and The YM futures contract. The YM contract is the DJIA and the purpose is to show reverse correlation between the two instruments. Remember it’s liken to a seesaw, when up goes up the other should go down and vice versa.
On Friday the ZB made it’s move at around 10 AM EST with the bulk of the economic news reported. The ZB hit a high at around that time and the YM hit a low. If you look at the charts below ZB gave a signal at around 10 AM EST and the YM was moving higher at the same time. Look at the charts below and you’ll see a pattern for both assets. ZB hit a high at around 10 AM EST and the YM hit a low. These charts represent the newest version of Trend Following Trades and I’ve changed the timeframe to a 30 minute chart to display better. This represented a shorting opportunity on the 30 year bond, as a trader you could have netted about 30 plus ticks per contract on this trade. Each tick is worth $31.25. We added a Donchian Channel to the charts to show the signals more clearly. Charts Courtesy of Trend Following Trades built on a NinjaTrader platform Click on an image to enlarge it.
Bias
Given that Friday was a Non Farm Payroll Day we maintained a neutral bias which means the markets could go in any direction. The Dow gained 65 points and the other indices gained ground as well. Today we aren’t dealing with a correlated market and will maintain a neutral bias.
Could this change? Of Course. Remember anything can happen in a volatile market.
Commentary
Friday began with a payroll report that showed a gain of 156,000 new jobs created for December. This did not meet the expectation of 175,000 jobs however it also reported an Average Hourly gain of 0.4% which hasn’t been seen since 2007. The markets did gain based on this and the Dow tapped 20,000 but did not exceed it. According to some reports, it came in at 19,999.63; talk about close!!! Some will say that it didn’t exceed the 20,000 level because of a gun shooting incident in the Fort Lauderdale airport, in which 4 people were killed. In our opinion the market seems to be gathering momentum in order to exceed 20,000. Could this happen? Yes, but only time will tell when.
Author

Nick Mastrandrea
Market Tea Leaves


