Good Morning Traders,

As of this writing 4:30 AM EST, here’s what we see:

US Dollar: June USD is Down at 96.650.
Energies: April '19 Crude is Up at 62.89.
Financials: The Jun 30 year bond is Down 25 ticks and trading at 147.17.
Indices: The June S&P 500 emini ES contract is 62 ticks Higher and trading at 2882.50.
Gold: The April Gold contract is trading Up at 1296.00 Gold is 6 ticks Higher than its close.

Initial Conclusion

This is not a correlated market. The dollar is Down- and Crude is Up+ which is normal and the 30 year Bond is trading Lower. The Financials should always correlate with the US dollar such that if the dollar is lower then bonds should follow and vice-versa. The S&P is Higher and Crude is trading Higher which is not correlated. Gold is trading Higher which is correlated with the US dollar trading Down. I tend to believe that Gold has an inverse relationship with the US Dollar as when the US Dollar is down, Gold tends to rise in value and vice-versa. Think of it as a seesaw, when one is up the other should be down. I point this out to you to make you aware that when we don't have a correlated market, it means something is wrong. As traders you need to be aware of this and proceed with your eyes wide open.

At this hour all of Asia is trading Higher. Currently Europe is trading Higher as well with the exception of the London exchange which is fractionally Lower at this time.

Possible Challenges To Traders Today

  • ADP Non-Farm Employment Change is out at 8:30 AM. Major

  • Final Services PMI is out at 9:45 AM EST. Major.

  • ISM Non-Manufacturing PMI is out at 10 AM. This is major.

  • Crude Oil Inventories is out at 10:30 AM EST. This is major.

 Treasuries

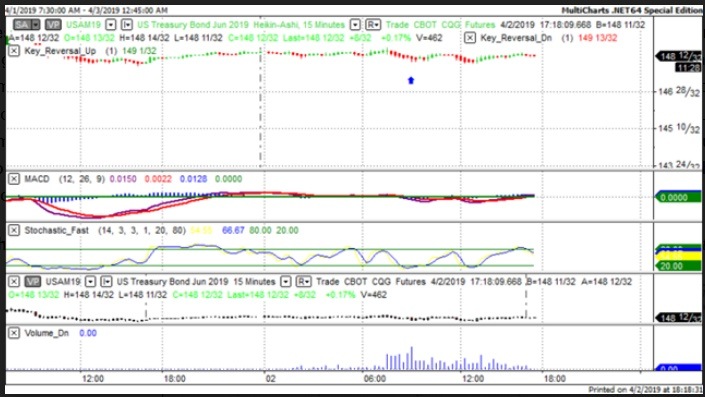
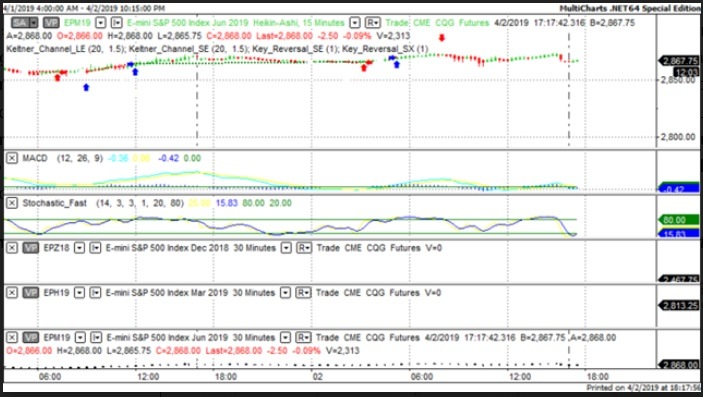
We've elected to switch gears a bit and show correlation between the 30 year bond (ZB) and The YM futures contract. The YM contract is the DJIA and the purpose is to show reverse correlation between the two instruments. Remember it's liken to a seesaw, when up goes up the other should go down and vice versa.

Yesterday the ZB made a major move at around 8 AM EST. The ZB hit a Low at around that time and the YM hit a High. If you look at the charts below ZB gave a signal at around 8 AM EST and the YM was moving Higher at the same time. Look at the charts below and you'll see a pattern for both assets. ZB hit a Low at around 8 AM and the YM was moving Lower at the same time. These charts represent the newest version of MultiCharts and I've changed the timeframe to a 15 minute chart to display better. This represented a Long opportunity on the 30 year bond, as a trader you could have netted about 12 ticks per contract on this trade. Each tick is worth $31.25. Please note: the front month for the ZB contract is now June, 2019

Charts Courtesy of MultiCharts built on an AMP platform.

Tea

Tea

Bias

Yesterday we gave the markets a Downside bias as the USD, Bonds and Gold were all trading Higher and this usually represents a Downside day. The Dow dropped 300 points but the other indices gained ground. Today we aren't dealing with a correlated market and our bias is to the Upside.

Could this change? Of Course. Remember anything can happen in a volatile market.

Commentary

Yesterday we called for a downside bias and it appears as though for the Dow this remained the case. The economic news reported yesterday wasn't stellar. Durable Goods and Core Durable Goods came in less than expected and did not meet expectation. From our perspective we will just follow our rules for market correlation and judge accordingly. Today we have ADP Non-Farm Employment which will tie in with Friday's Non-Farm Payrolls.

Trading performance displayed herein is hypothetical. The following Commodity Futures Trading Commission (CFTC) disclaimer should be noted.

Hypothetical performance results have many inherent limitations, some of which are described below. No representation is being made that any account will or is likely to achieve profits or losses similar to those shown.

In fact, there are frequently sharp differences between hypothetical performance results and the actual results subsequently achieved by any particular trading program. One of the limitations of hypothetical performance trading results is that they are generally prepared with the benefit of hindsight.

In addition, hypothetical trading does not involve financial risk, and no hypothetical trading record can completely account for the impact of financial risk in actual trading. For example, the ability to withstand losses or to adhere to a particular trading program in spite of trading losses are material points which can also adversely affect actual trading results.

There are numerous other factors related to the markets in general or to the implementation of any specific trading program which cannot be fully accounted for in the preparation of hypothetical performance results and all of which can adversely affect actual trading results.

Trading in the commodities markets involves substantial risk and YOU CAN LOSE A LOT OF MONEY, and thus is not appropriate for everyone. You should carefully consider your financial condition before trading in these markets, and only risk capital should be used.

In addition, these markets are often liquid, making it difficult to execute orders at desired prices. Also, during periods of extreme volatility, trading in these markets may be halted due to so-called “circuit breakers” put in place by the CME to alleviate such volatility. In the event of a trading halt, it may be difficult or impossible to exit a losing position.

Recommended Content


Recommended Content

Editors’ Picks

EUR/USD holds steady near 1.0650 amid risk reset

EUR/USD holds steady near 1.0650 amid risk reset

EUR/USD is holding onto its recovery mode near 1.0650 in European trading on Friday. A recovery in risk sentiment is helping the pair, as the safe-haven US Dollar pares gains. Earlier today, reports of an Israeli strike inside Iran spooked markets. 

EUR/USD News

GBP/USD recovers toward 1.2450 after UK Retail Sales data

GBP/USD recovers toward 1.2450 after UK Retail Sales data

GBP/USD is rebounding toward 1.2450 in early Europe on Friday, having tested 1.2400 after the UK Retail Sales volumes stagnated again in March, The pair recovers in tandem with risk sentiment, as traders take account of the likely Israel's missile strikes on Iran. 

GBP/USD News

Gold: Middle East war fears spark fresh XAU/USD rally, will it sustain?

Gold: Middle East war fears spark fresh XAU/USD rally, will it sustain?

Gold price is trading close to $2,400 early Friday, reversing from a fresh five-day high reached at $2,418 earlier in the Asian session. Despite the pullback, Gold price remains on track to book the fifth weekly gain in a row.

Gold News

Bitcoin Price Outlook: All eyes on BTC as CNN calls halving the ‘World Cup for Bitcoin’

Bitcoin Price Outlook: All eyes on BTC as CNN calls halving the ‘World Cup for Bitcoin’

Bitcoin price remains the focus of traders and investors ahead of the halving, which is an important event expected to kick off the next bull market. Amid conflicting forecasts from analysts, an international media site has lauded the halving and what it means for the industry.   

Read more

Geopolitics once again take centre stage, as UK Retail Sales wither

Geopolitics once again take centre stage, as UK Retail Sales wither

Nearly a week to the day when Iran sent drones and missiles into Israel, Israel has retaliated and sent a missile into Iran. The initial reports caused a large uptick in the oil price.

Read more

Majors

Cryptocurrencies

Signatures