Dow Takes a Dive
Good Morning Traders,
As of this writing 4:10 AM EST, here’s what we see:
US Dollar: Dec. USD is Down at 95.045.
Energies: Nov '18 Crude is Down at 72.29.
Financials: The Dec 30 year bond is Up 36 ticks and trading at 138.12.
Indices: The Dec S&P 500 emini ES contract is 89 ticks Lower and trading at 2883.50.
Gold: The Dec Gold contract is trading Up+ at 1201.60. Gold is 82 ticks Lower than its close.
Initial Conclusion
This is not a correlated market. The dollar is Down- and Crude is Down- which is not normal but the 30 year Bond is trading Higher. The Financials should always correlate with the US dollar such that if the dollar is lower then bonds should follow and vice-versa. The S&P is Lower and Crude is trading Lower which is not correlated. Gold is trading Up+ which is correlated with the US dollar trading Lower. I tend to believe that Gold has an inverse relationship with the US Dollar as when the US Dollar is down, Gold tends to rise in value and vice-versa. Think of it as a seesaw, when one is up the other should be down. I point this out to you to make you aware that when we don't have a correlated market, it means something is wrong. As traders you need to be aware of this and proceed with your eyes wide open.
At this hour all of Asia is trading to the Downside with many exchanges is negative triple digit territory. Currently all of Europe is trading Lower as well.
Possible Challenges To Traders Today
-
CPI m/m is out at 8:30 AM EST. Major.
-
Core CPI m/m is out at 8:30 AM EST. Major.
-
Unemployment Claims are out at 8:30 AM EST. Major.
-
Natural Gas Storage is out at 10:30 AM EST. This is Major.
-
Crude Oil Inventories are out at 11 AM EST. This is Major.
-
30-y Bond Auction starts at 1 PM EST. This is major.
-
Treasury Currency Report - tentative
Treasuries
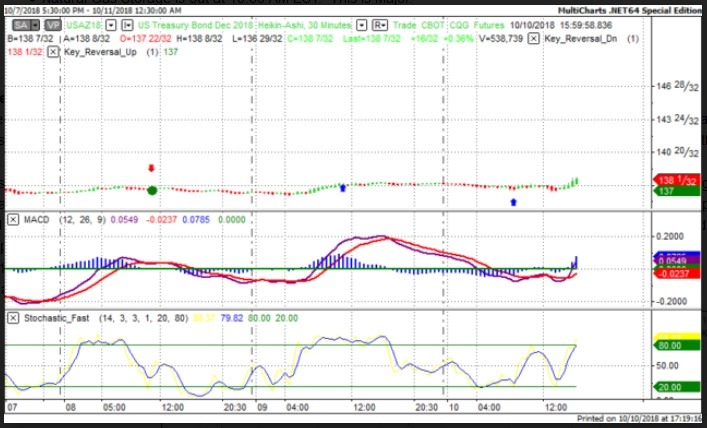
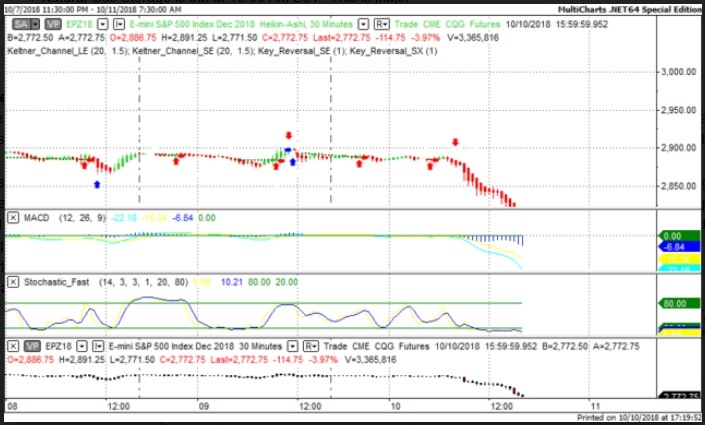
We've elected to switch gears a bit and show correlation between the 30 year bond (ZB) and The YM futures contract. The YM contract is the DJIA and the purpose is to show reverse correlation between the two instruments. Remember it's liken to a seesaw, when up goes up the other should go down and vice versa.
Yesterday the ZB made it's move at around 8:30 AM EST. The ZB hit a Low at around that time and the YM hit a High. If you look at the charts below ZB gave a signal at around 8:30 AM EST and the YM was moving Lower at the same time. Look at the charts below and you'll see a pattern for both assets. ZB hit a Low at around 8:30 AM and the YM was moving Lower at the same time. These charts represent the newest version of MultiCharts and I've changed the timeframe to a 30 minute chart to display better. This represented a Long opportunity on the 30 year bond, as a trader you could have netted about 15 ticks per contract on this trade. Each tick is worth $31.25.
Charts Courtesy of MultiCharts built on an AMP platform.
Bias
Yesterday we gave the markets a Neutral bias as just about all instruments were pointed Lower. The Dow dropped 832 points, the Nasdaq lost 316 and the S&P lost 95. Today we aren't dealing with a correlated market and our bias is to the Downside.
Could this change? Of Course. Remember anything can happen in a volatile market.
Commentary
Yesterday morning just about every instrument we track was pointed Lower and whenever you have a situation where everything is either pointed Higher or conversely pointed Lower; then there is no correlation. Hence the Neutral bias. A Neutral bias means the markets could go in any direction and yesterday they certainly did!! An 800 point drop in 1 day is no small matter. The analysts and pundits have been predicting this for quite some time. The question being is this a one day situation or something else?? Only time will tell....
Author

Nick Mastrandrea
Market Tea Leaves


