Dow Keeps Its Head Above Water
Good Morning Traders,
As of this writing 4 AM EST, here’s what we see:
US Dollar: Sept. USD is Down at 93.705.
Energies: Sept Crude is Up at 47.85.
Financials: The Sept 30 year bond is Down 10 ticks and trading at 154.03.
Indices: The Sept S&P 500 emini ES contract is 19 ticks Higher and trading at 2468.50.
Gold: The Dec gold contract is trading Down at 1275.60. Gold is 41 ticks Lower than its close.
Initial Conclusion
This is not a correlated market. The dollar is Down- and Crude is Up+ which is normal and the 30 year Bond is trading Lower. The Financials should always correlate with the US dollar such that if the dollar is lower then bonds should follow and vice-versa. The indices are Up+ and Crude is trading Up+ which is not correlated. Gold is trading Down which is not correlated with the US dollar trading Down-. I tend to believe that Gold has an inverse relationship with the US Dollar as when the US Dollar is down, Gold tends to rise in value and vice-versa. Think of it as a seesaw, when one is up the other should be down. I point this out to you to make you aware that when we don’t have a correlated market, it means something is wrong. As traders you need to be aware of this and proceed with your eyes wide open.
At this hour Asia is trading mainly Lower with the exception of the Hang Seng and Sensex exchanges which are trading Higher. At this hour all of Europe is trading Higher.
Possible Challenges To Traders Today
– Building Permits is out at 8:30 AM EST. This is major..
– Housing Starts is out at 8:30 AM EST. This is major.
– Crude Oil Inventories is out at 10:30 AM EST. This is major.
– FOMC Meeting Minutes is out at 2 PM EST. This is major.
Treasuries
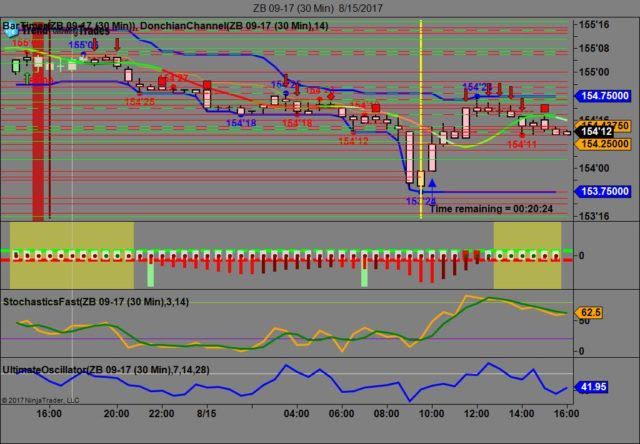
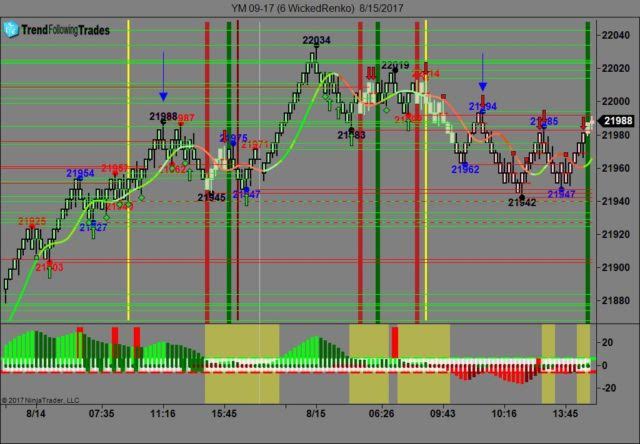
We’ve elected to switch gears a bit and show correlation between the 30 year bond (ZB) and The YM futures contract. The YM contract is the DJIA and the purpose is to show reverse correlation between the two instruments. Remember it’s liken to a seesaw, when up goes up the other should go down and vice versa.
Yesterday the ZB made it’s move at around 10 AM EST after the economic news was reported. The ZB hit a Low at around that time and the YM hit a High. If you look at the charts below ZB gave a signal at around 10 AM and the YM was moving Lower at the same time. Look at the charts below and you’ll see a pattern for both assets. ZB hit a Low at around 10 AM and the YM hit a High. These charts represent the newest version of Trend Following Trades and I’ve changed the timeframe to a 30 minute chart to display better. This represented a long opportunity on the 30 year bond, as a trader you could have netted about 20 plus ticks per contract on this trade. Each tick is worth $31.25. We added a Donchian Channel to the charts to show the signals more clearly. Please note that the front month for the ZB contract is now September, 2017.
Charts Courtesy of Trend Following Trades built on a NinjaTrader platform Click on an image to enlarge it.
Bias
Yesterday we gave the markets an upside bias as Crude, the Bonds and Gold were all trading lower yesterday morning and this does bode well for an upside day. The Dow did close higher by about 5 points but the S&P and Nasdaq closed lower fractionally. Today we aren’t dealing with a correlated market and will maintain our upside bias.
Could this change? Of Course. Remember anything can happen in a volatile market.
Commentary
Well it looks like the political intrigue with North Korea continued to take a back seat yesterday although the Koreans are maintaining an aggressive stance and are leaving the door open for further aggression. The Dow and the other indices opened higher but began to trade lower during the session as Home Depot dropped about 5% during the trading session and drove the Dow lower. The Dow however managed to recoup close higher (as predicted). Not a stellar day not a disaster either. Today we have the FOMC Meeting Minutes out at 2 PM EST this afternoon and a proven market mover.
Author

Nick Mastrandrea
Market Tea Leaves


