Dow Jones Technical Analysis: expecting a New Lower High

The Dow Jones in the 4-hour chart illustrates a long-term sideways structure with a potential bearish bias. The factors that make us expect a short position are:
In fundamental terms, the latest economic activity data reveal signs of stagnation. The recent ISM manufacturing PMI fell to 47.8%, the worst level since June 2009. On the other hand, the last non-manufacturing ISM reading also fell to 52.6% in September, the worst level since August 2016.
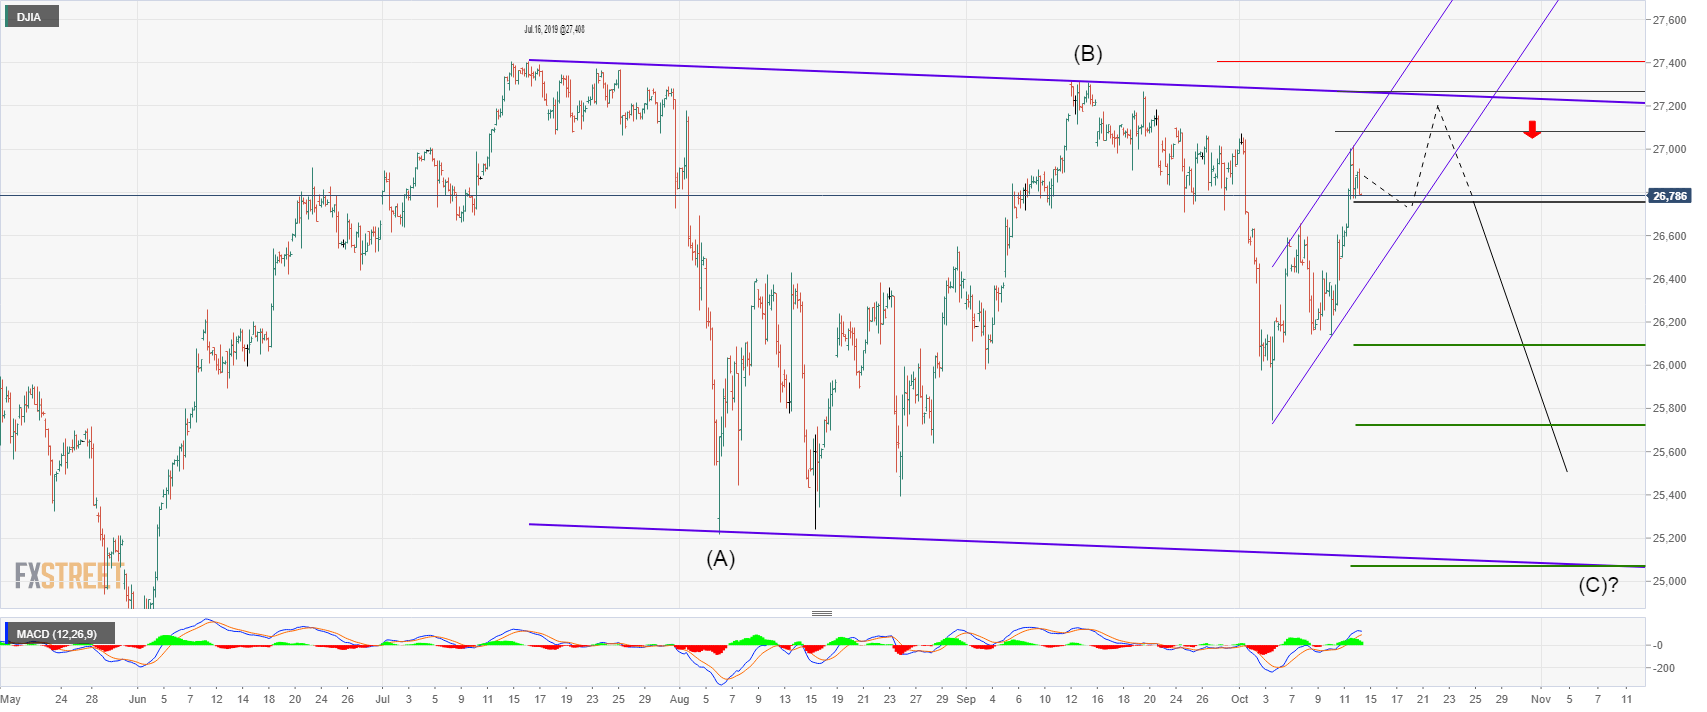
The long-term highs-and lows sequence in Dow Jones reflects that the index topped in mid-2019. After this high at 27,408 pts, DJIA develops a corrective formation which could correspond to a Flat pattern.
DJIA could reach a marginal high in the area between 27,075 pts and 27, 270 pts. However, we don't expect new record highs over 27,405 pts.
The bearish setup will activate if Dow Jones breaks down and closes below 26,750 pts.
Our first profit target (conservative scenario) is at 26,095 pts. The second target is the most probable level to be reached at 25,720 pts. And the final objective of the trade is at 25,070 pts. The final level could provide a risk/reward ratio of 2.56%
Trading plan summary
Entry Level: 26,750 pts.
Stop Loss: 27,410 pts.
1st Profit Target: 26,095 pts.
2nd Profit Target: 25,720 pts.
3rd Profit Target: 25,070 pts.
Author

EagleFX Team
EagleFX
EagleFX Team is an international group of market analysts with skills in fundamental and technical analysis, applying several methods to assess the state and likelihood of price movements on Forex, Commodities, Indices, Metals and


