Dow hits 26k…again

US Dollar: Sept USD is Down at 96.850.
Energies: Aug'20 Crude is Up at 41.33.
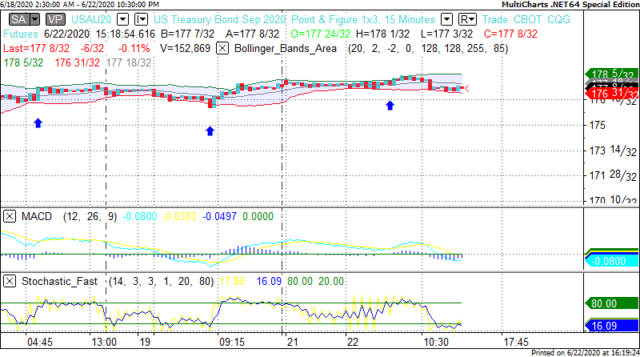
Financials: The Sept'20 30 year bond is Down 11 ticks and trading at 176.30.
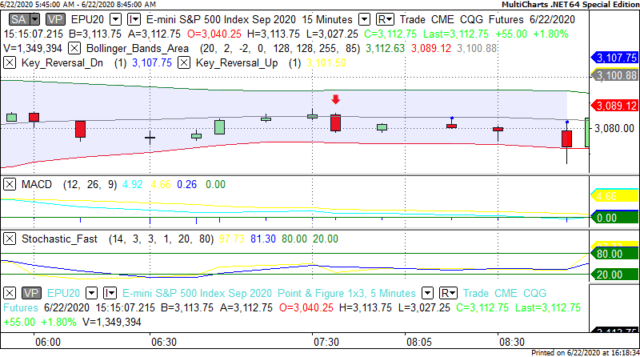
Indices: The Sept S&P 500 emini ES contract is 88 ticks Higher and trading at 3132.75.
Gold: The Aug'20 Gold contract is trading Up at 1771.60. Gold is 52 ticks Higher than its close.
Initial Conclusion
This is not a correlated market. The dollar is Down- and Crude is Up+ which is normal and the 30 year Bond is trading Lower as well. The Financials should always correlate with the US dollar such that if the dollar is lower then bonds should follow and vice-versa. The S&P is Higher and Crude is trading Higher which is not correlated. Gold is trading Higher which is correlated with the US dollar trading Down. I tend to believe that Gold has an inverse relationship with the US Dollar as when the US Dollar is down, Gold tends to rise in value and vice-versa. Think of it as a seesaw, when one is up the other should be down. I point this out to you to make you aware that when we don't have a correlated market, it means something is wrong. As traders you need to be aware of this and proceed with your eyes wide open.
At this time all of Asia is trading Higher. Currently all of Europe is trading Higher as well.
Possible Challenges To Traders Today:
- Flash Manufacturing PMI is out at 9:45 AM EST. This is Major.
- Flash Services PMI is out at 9:45 AM EST. This is Major.
- New Home Sales is out at 10 AM EST. This is Major.
- Richmond Manufacturing Index is out at 10 AM EST. This is Major.
Treasuries
We've elected to switch gears a bit and show correlation between the 30 year bond (ZB) and The S&P futures contract. The S&P contract is the Standard and Poor's and the purpose is to show reverse correlation between the two instruments. Remember it's liken to a seesaw, when up goes up the other should go down and vice versa.
Yesterday the ZB made it's move at around 8 AM EST. The ZB hit a Low at around that time and the S&P moved Lower. If you look at the charts below ZB gave a signal at around 8 AM EST and the S&P moved Lower at around the same time. Look at the charts below and you'll see a pattern for both assets. ZB hit a Low at around 8 AM EST and the S&P was moving Lower shortly thereafter. These charts represent the newest version of MultiCharts and I've changed the timeframe to a 15 minute chart to display better. This represented a Long opportunity on the 30 year bond, as a trader you could have netted about 15 ticks per contract on this trade. Each tick is worth $31.25. Please note: the front month for the ZB is now Sept '20. The S&P contract has been changed to Sept '20. I've changed the format to Renko bars such that it may be more apparent and visible.
Charts Courtesy of MultiCharts built on an AMP platform.
Bias
Yesterday we gave the markets a Neutral bias as we didn't see much in the way of correlation Monday morning. The Dow traded higher by 154 points and the other indices gained ground as well. Today we aren't dealing with a correlated market and our bias is to the Upside.
Could this change? Of Course. Remember anything can happen in a volatile market.
Commentary
It appears that the Dow has exceeded the 26,000 mark today and traders were popping champagne corks. There really shouldn't be much to celebrate as prior to the coronavirus situation the Dow was trading upwards past 29,000 and of course dropped dramatically after COVID 19 became front and center. Yesterday we didn't have much in the way of economic news except Existing Home Sales that did not meet expectation. Today we have much more on the docket as we have Flash Services, New Home sales and Richmond Manufacturing Index, all of which are major and proven market movers. Will this be enough to drive the markets forward? Only time will tell.
Author

Nick Mastrandrea
Market Tea Leaves
Nick Mastrandrea over 20 years experience in trading and formerly held a NASD Series 7. He currently holds a NJ Life, Health and Variable Authority. Nick is a published writer and his work has appeared in Futures Magazine, TraderPlanet and others.


