Dow Drops…slightly

Good Morning Traders,
As of this writing 4 AM EST, here’s what we see:
US Dollar: Jun. USD is Down at 89.305.
Energies: Jun '18 Crude is Up at 69.01.
Financials: The June 30 year bond is Down 14 ticks and trading at 144.16.
Indices: The June S&P 500 emini ES contract is 9 ticks Lower and trading at 2707.50.
Gold: The June gold contract is trading Up at 1356.30. Gold is 28 ticks Higher than its close.
Initial Conclusion
This is not a correlated market. The dollar is Down- and Crude is Up+ which is normal and the 30 year Bond is trading Lower. The Financials should always correlate with the US dollar such that if the dollar is lower then bonds should follow and vice-versa. The S&P is Lower- and Crude is trading Higher+ which is correlated. Gold is trading Up+ which is correlated with the US dollar trading Down-. I tend to believe that Gold has an inverse relationship with the US Dollar as when the US Dollar is down, Gold tends to rise in value and vice-versa. Think of it as a seesaw, when one is up the other should be down. I point this out to you to make you aware that when we don't have a correlated market, it means something is wrong. As traders you need to be aware of this and proceed with your eyes wide open.
At this hour all of Asia is trading Higher. All of Europe is trading Higher at this time with the exception of the German Dax which is fractionally Lower at this hour.
Possible Challenges To Traders Today
-
FOMC Member Brainard Speaks at 8 AM EST. This is major.
-
Philly Fed Mfg Index is out at 2 PM EST. This is major.
-
Unemployment Claims is out at 8:30 AM EST. This is major.
-
FOMC Member Quarles Speaks at 9:30 AM. This is major.
-
CB Leading Index m/m is out at 10 AM EST. This is major.
-
Natural Gas Storage is out at 10:30 AM EST. This is major.
Treasuries
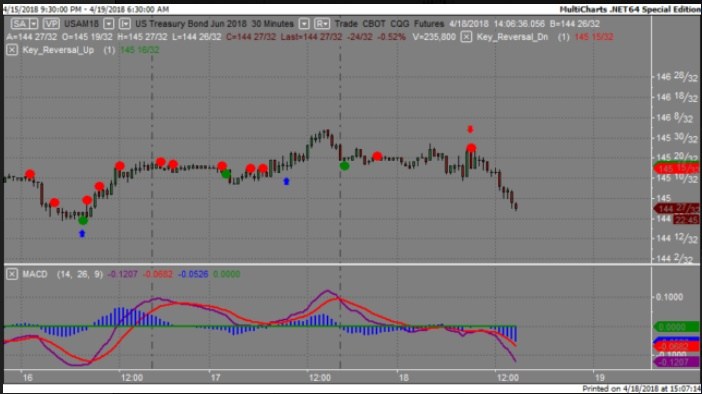
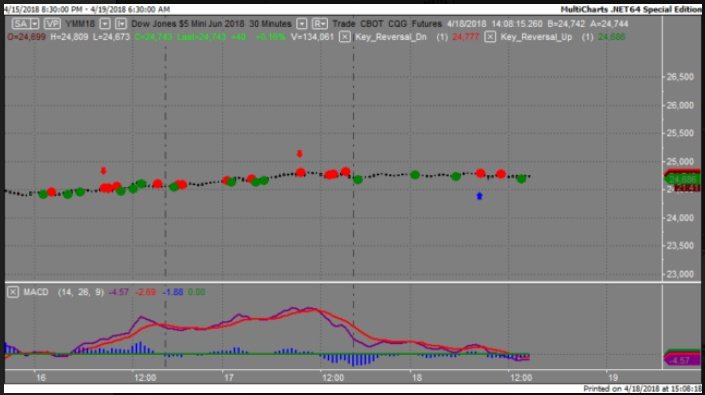
We've elected to switch gears a bit and show correlation between the 30 year bond (ZB) and The YM futures contract. The YM contract is the DJIA and the purpose is to show reverse correlation between the two instruments. Remember it's liken to a seesaw, when up goes up the other should go down and vice versa.
Yesterday the ZB made it's move at around 9 AM EST. The ZB hit a High at around that time and the YM hit a Low. If you look at the charts below ZB gave a signal at around 9 AM EST and the YM was moving sideways at the same time. Look at the charts below and you'll see a pattern for both assets. ZB hit a High at around 9 AM and the YM was traveling in sideways pattern. These charts represent the newest version of MultiCharts and I've changed the timeframe to a 30 minute chart to display better. This represented a long opportunity on the 30 year bond, as a trader you could have netted about 20 plus ticks per contract on this trade. Each tick is worth $31.25.
Charts Courtesy of MultiCharts built on an AMP platform.
Bias
Yesterday we gave the markets an Upside bias as the Bonds and Gold were all trading Lower yesterday morning and this usually reflects the basis of an Upside day. The markets however had other ideas as the Dow dropped by 39 points but the S&P and Nasdaq both finished in positive territory. All in all a mixed day. Today we aren't dealing with a correlated market and our bias is Neutral.
Could this change? Of Course. Remember anything can happen in a volatile market.
Commentary
You can tell that it's earning season when IBM reports not too stellar numbers and the markets fall, which is exactly what happened yesterday. We have long said that trading stocks is dependent upon good economic news as well as good company news, i.e. earnings. Today we have Philly Fed Manufacturing Index as well as weekly Unemployment Claims both of which are major and proven market movers. Time will tell how this resonates with the markets.
Author

Nick Mastrandrea
Market Tea Leaves


