US Dollar: Sept. USD is Down at 96.915.

Energies: Aug Crude is Up at 43.57.

Financials: The Sept 30 year bond is Down 4 ticks and trading at 156.16.

Indices: The Sept S&P 500 emini ES contract is 22 ticks Higher and trading at 2440.25.

Gold: The Aug gold contract is trading Down at 1254.80.  Gold is 15 ticks Lower than its close.

Initial Conclusion

This is not a correlated market.  The dollar is Down- and Crude is Up+ which is normal and the 30 year Bond is trading Lower.  The Financials should always correlate with the US dollar such that if the dollar is lower then bonds should follow and vice-versa. The indices are Up and Crude is trading Up+ which is not correlated. Gold is trading Down- which is not correlated with the US dollar trading Down-.   I tend to believe that Gold has an inverse relationship with the US Dollar as when the US Dollar is down, Gold tends to rise in value and vice-versa. Think of it as a seesaw, when one is up the other should be down. I point this out to you to make you aware that when we don’t have a correlated market, it means something is wrong. As traders you need to be aware of this and proceed with your eyes wide open.

At this hour Asia is trading mainly Higher with the exception of the Indian Sensex and Singapore exchanges.  All of Europe is trading Higher at this hour.

Possible Challenges To Traders Today

–  Core Durable Goods Orders is out at 8:30 AM EST.  This is major.

–  Durable Goods Orders m/m is out at 8:30 AM EST.  This is major.

Treasuries

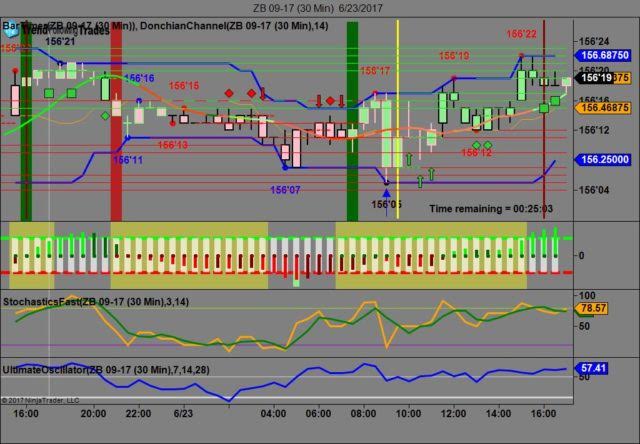
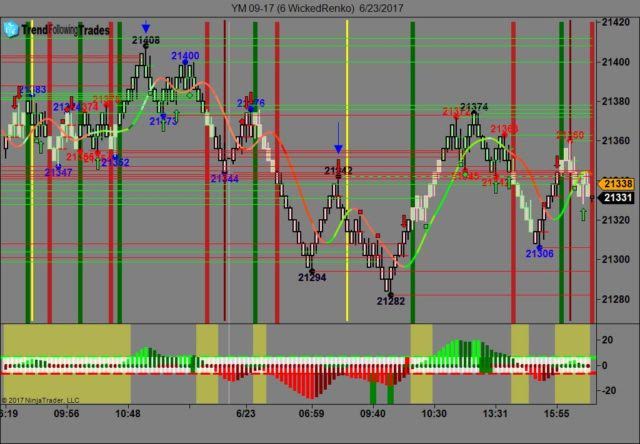
We’ve elected to switch gears a bit and show correlation between the 30 year bond (ZB) and The YM futures contract.  The YM contract is the DJIA and the purpose is to show reverse correlation between the two instruments.  Remember it’s liken to a seesaw, when up goes up the other should go down and vice versa.

On Friday the ZB made it’s move at around 9 AM EST prior to the  economic news being reported.  The ZB hit a low at around that time and the YM hit a high.  If you look at the charts below ZB gave a signal at around 9 AM and the YM was moving lower at the same time. Look at the charts below and you’ll see a pattern for both assets. ZB hit a low at around 9 AM and the YM hit a high.  These charts represent the newest version of Trend Following Trades and I’ve changed the timeframe to a 30 minute chart to display better.  This represented a long opportunity on the 30 year bond, as a trader you could have netted about 15 plus ticks per contract on this trade.  Each tick is worth $31.25.  We added a Donchian Channel to the charts to show the signals more clearly.  Please note that the front month for the ZB contract is now September, 2017.

Charts Courtesy of Trend Following Trades built on a NinjaTrader platform.

ZB


YM

Bias

On Friday we gave the markets an upside bias as the USD and the Bonds were both trading down Friday morning.  The Dow closed lower by about 3 points but the S&P and Nasdaq both closed higher.  Today we aren’t dealing with a correlated however our bias is to the upside.

Could this change? Of Course.  Remember anything can happen in a volatile market. 

Commentary

On Friday we gave the markets an upside bias as we just followed our rules on Market Correlation which would suggest such a bias.  The Dow in particular was all over the map on Friday as it initially dropped, then went higher then dropped and went higher again.  If the markets had been over a little while longer it probably would have wound up in positive territory as suggested.  However the S&P and Nasdaq both traded higher.

Trading performance displayed herein is hypothetical. The following Commodity Futures Trading Commission (CFTC) disclaimer should be noted.

Hypothetical performance results have many inherent limitations, some of which are described below. No representation is being made that any account will or is likely to achieve profits or losses similar to those shown.

In fact, there are frequently sharp differences between hypothetical performance results and the actual results subsequently achieved by any particular trading program. One of the limitations of hypothetical performance trading results is that they are generally prepared with the benefit of hindsight.

In addition, hypothetical trading does not involve financial risk, and no hypothetical trading record can completely account for the impact of financial risk in actual trading. For example, the ability to withstand losses or to adhere to a particular trading program in spite of trading losses are material points which can also adversely affect actual trading results.

There are numerous other factors related to the markets in general or to the implementation of any specific trading program which cannot be fully accounted for in the preparation of hypothetical performance results and all of which can adversely affect actual trading results.

Trading in the commodities markets involves substantial risk and YOU CAN LOSE A LOT OF MONEY, and thus is not appropriate for everyone. You should carefully consider your financial condition before trading in these markets, and only risk capital should be used.

In addition, these markets are often liquid, making it difficult to execute orders at desired prices. Also, during periods of extreme volatility, trading in these markets may be halted due to so-called “circuit breakers” put in place by the CME to alleviate such volatility. In the event of a trading halt, it may be difficult or impossible to exit a losing position.

Recommended Content


Recommended Content

Editors’ Picks

EUR/USD holds below 1.0750 ahead of key US data

EUR/USD holds below 1.0750 ahead of key US data

EUR/USD trades in a tight range below 1.0750 in the European session on Friday. The US Dollar struggles to gather strength ahead of key PCE Price Index data, the Fed's preferred gauge of inflation, and helps the pair hold its ground. 

EUR/USD News

GBP/USD consolidates above 1.2500, eyes on US PCE data

GBP/USD consolidates above 1.2500, eyes on US PCE data

GBP/USD fluctuates at around 1.2500 in the European session on Friday following the three-day rebound. The PCE inflation data for March will be watched closely by market participants later in the day.

GBP/USD News

Gold clings to modest daily gains at around $2,350

Gold clings to modest daily gains at around $2,350

Gold stays in positive territory at around $2,350 after closing in positive territory on Thursday. The benchmark 10-year US Treasury bond yield edges lower ahead of US PCE Price Index data, allowing XAU/USD to stretch higher.

Gold News

Bitcoin Weekly Forecast: BTC’s next breakout could propel it to $80,000 Premium

Bitcoin Weekly Forecast: BTC’s next breakout could propel it to $80,000

Bitcoin’s recent price consolidation could be nearing its end as technical indicators and on-chain metrics suggest a potential upward breakout. However, this move would not be straightforward and could punish impatient investors. 

Read more

US core PCE inflation set to signal firm price pressures as markets delay Federal Reserve rate cut bets

US core PCE inflation set to signal firm price pressures as markets delay Federal Reserve rate cut bets

The core PCE Price Index, which excludes volatile food and energy prices, is seen as the more influential measure of inflation in terms of Fed positioning. The index is forecast to rise 0.3% on a monthly basis in March, matching February’s increase. 

Read more

Majors

Cryptocurrencies

Signatures