Dow Drops Below 19K [Video]
![Dow Drops Below 19K [Video]](https://editorial.fxstreet.com/images/Markets/Equities/DowJones/bloomberg-app-on-iphone-4-with-market-data-17118657_XtraLarge.jpg)
US Dollar: June USD is Down at 103.410.
Energies: April'20 Crude Down at 22.56.
Financials: The June'20 30 year bond is Up 73 ticks and trading at 178.08.
Indices: The March S&P 500 emini ES contract is 268 ticks Lower and trading at 2221.00.
Gold: The April '20 Gold contract is trading Up at 1495.00. Gold is 103 ticks Higher than its close.
Initial Conclusion
This is not a correlated market. The dollar is Down- and Crude is Down- which is not normal but the 30 year Bond is trading Higher. The Financials should always correlate with the US dollar such that if the dollar is lower then bonds should follow and vice-versa. The S&P is Lower and Crude is trading Lower which is not correlated. Gold is trading Higher which is correlated with the US dollar trading Down. I tend to believe that Gold has an inverse relationship with the US Dollar as when the US Dollar is down, Gold tends to rise in value and vice-versa. Think of it as a seesaw, when one is up the other should be down. I point this out to you to make you aware that when we don't have a correlated market, it means something is wrong. As traders you need to be aware of this and proceed with your eyes wide open.
At this time all of Asia is trading Lower with the exception of the Nikkei exchange. Currently all of Europe is trading Lower.
Possible Challenges To Traders Today:
-
No Major economic news to speak of.
-
Lack of Major economic news.
Treasuries
We've elected to switch gears a bit and show correlation between the 30 year bond (ZB) and The S&P futures contract. The S&P contract is the Standard and Poor's and the purpose is to show reverse correlation between the two instruments. Remember it's liken to a seesaw, when up goes up the other should go down and vice versa.
On Friday the ZB made a move at around 9:30 AM EST. The ZB hit a Low at around that time and the S&P moved Lower. If you look at the charts below ZB gave a signal at around 9:30 AM and the S&P moved Lower at around the same time. Look at the charts below and you'll see a pattern for both assets. ZB hit a Low at around 9:30 AM EST and the S&P was moving Lower shortly thereafter. These charts represent the newest version of MultiCharts and I've changed the timeframe to a 15 minute chart to display better. This represented a Long opportunity on the 30 year bond, as a trader you could have netted 90 plus ticks per contract on this trade. Each tick is worth $31.25. Please note: the front month for the ZB is now June '20. The S&P contract is now June '20 as well. I've changed the format to Renko bars such that it may be more apparent and visible.
Charts Courtesy of MultiCharts built on an AMP platform
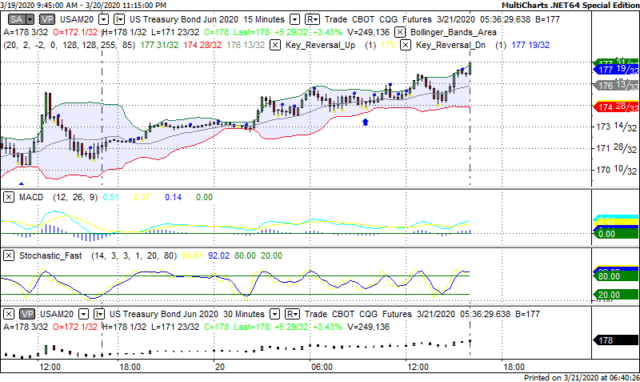
ZB - June, 2020 - 3/20/20
-637205566500541287.png)
SP June 2020 - 3/20/20
Bias
On Friday we gave the markets a Neutral bias as we saw no evidence of Market Correlation on Friday morning. The Dow dropped 992 points and the other indices lost ground as well. Today we aren't dealing with a correlated market and our bias is to the Downside.
Could this change? Of Course. Remember anything can happen in a volatile market.
Commentary
It appears as though the markets are in free fall as the coronavirus is taking over the news. The Dow dropped below 19,000 on Friday and hasn't been in that territory since 2017. More and more states are jumping on the shutdown bandwagon and the Federal government will not announce a nationwide shutdown. Economists are now suggesting Unemployment Claims at around 2.5 million which is about 10 times more than it is now. We do think that at some point the short sellers will buy back their positions and in essence we will have a dead cat bounce, but as in all things time will tell how that all works out...
Author

Nick Mastrandrea
Market Tea Leaves


