Good Morning Traders,

As of this writing 4 AM EST, here’s what we see:

US Dollar: Jun. USD is Up at 89.760.
Energies:
Jun '18 Crude is Down at 68.04.
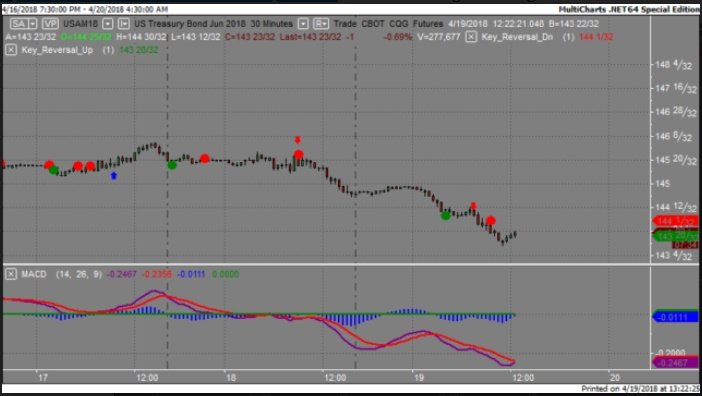
Financials:
The June 30 year bond is Down 3 ticks and trading at 143.22.
Indices:
The June S&P 500 emini ES contract is 33 ticks Lower and trading at 2684.50.
Gold:
The June gold contract is trading Down at 1344.20. Gold is 46 ticks Lower than its close.

Initial Conclusion

This is not a correlated market. The dollar is Up+ and Crude is Down- which is normal but the 30 year Bond is trading Lower. The Financials should always correlate with the US dollar such that if the dollar is lower then bonds should follow and vice-versa. The S&P is Lower- and Crude is trading Lower- which is not correlated. Gold is trading Down- which is correlated with the US dollar trading Up+. I tend to believe that Gold has an inverse relationship with the US Dollar as when the US Dollar is down, Gold tends to rise in value and vice-versa. Think of it as a seesaw, when one is up the other should be down. I point this out to you to make you aware that when we don't have a correlated market, it means something is wrong. As traders you need to be aware of this and proceed with your eyes wide open.

At this hour all of Asia is trading Lower. All of Europe is trading Lower at this time with the exception of the London exchange which is trading Higher at this hour.

Possible Challenges To Traders Today

  • FOMC Member Williams Speaks at 11:15 AM EST. This is major.

  • Lack of Major Economic News

 Treasuries

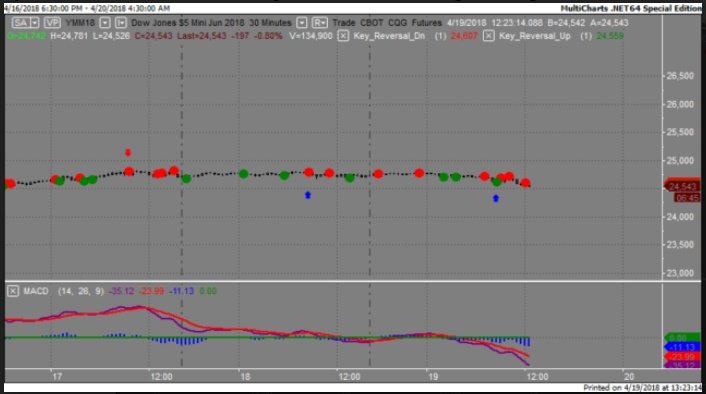
We've elected to switch gears a bit and show correlation between the 30 year bond (ZB) and The YM futures contract. The YM contract is the DJIA and the purpose is to show reverse correlation between the two instruments. Remember it's liken to a seesaw, when up goes up the other should go down and vice versa.

Yesterday the ZB made it's move at around 8:30 AM EST. The ZB hit a High at around that time and the YM hit a Low. If you look at the charts below ZB gave a signal at around 8:30 AM EST and the YM was moving sideways at the same time. Look at the charts below and you'll see a pattern for both assets. ZB hit a High at around 8:30 AM and the YM was traveling in a sideways pattern. These charts represent the newest version of MultiCharts and I've changed the timeframe to a 30 minute chart to display better. This represented a long opportunity on the 30 year bond, as a trader you could have netted about 30 plus ticks per contract on this trade. Each tick is worth $31.25.

Charts Courtesy of MultiCharts built on an AMP platform.

Tea

Tea

Bias

Yesterday we gave the markets a Neutral bias as the USD and the Bonds were trading Lower and in theory the indices should have been trading Higher but weren't, hence the Neutral bias. Today we aren't dealing with a correlated market and will maintain a Neutral bias.

Could this change? Of Course. Remember anything can happen in a volatile market.

Commentary

Yesterday we had Philly Fed Manufacturing Index that exceeded expectation and Unemployment Claims that came in lower than the week before; which of course is positive. This wasn't enough to quell the short sellers out there as the indices all traded lower yesterday. The Dow closed 83 points lower and the other indices lost ground as well. Today we only have one FOMC member speaking at 11:15 AM EST. That's it. There is no further economic news for today so the markets will be left up to own devices. Time will tell how this resonates.

Trading performance displayed herein is hypothetical. The following Commodity Futures Trading Commission (CFTC) disclaimer should be noted.

Hypothetical performance results have many inherent limitations, some of which are described below. No representation is being made that any account will or is likely to achieve profits or losses similar to those shown.

In fact, there are frequently sharp differences between hypothetical performance results and the actual results subsequently achieved by any particular trading program. One of the limitations of hypothetical performance trading results is that they are generally prepared with the benefit of hindsight.

In addition, hypothetical trading does not involve financial risk, and no hypothetical trading record can completely account for the impact of financial risk in actual trading. For example, the ability to withstand losses or to adhere to a particular trading program in spite of trading losses are material points which can also adversely affect actual trading results.

There are numerous other factors related to the markets in general or to the implementation of any specific trading program which cannot be fully accounted for in the preparation of hypothetical performance results and all of which can adversely affect actual trading results.

Trading in the commodities markets involves substantial risk and YOU CAN LOSE A LOT OF MONEY, and thus is not appropriate for everyone. You should carefully consider your financial condition before trading in these markets, and only risk capital should be used.

In addition, these markets are often liquid, making it difficult to execute orders at desired prices. Also, during periods of extreme volatility, trading in these markets may be halted due to so-called “circuit breakers” put in place by the CME to alleviate such volatility. In the event of a trading halt, it may be difficult or impossible to exit a losing position.

Recommended Content


Recommended Content

Editors’ Picks

USD/JPY holds near 155.50 after Tokyo CPI inflation eases more than expected

USD/JPY holds near 155.50 after Tokyo CPI inflation eases more than expected

USD/JPY is trading tightly just below the 156.00 handle, hugging multi-year highs as the Yen continues to deflate. The pair is trading into 30-plus year highs, and bullish momentum is targeting all-time record bids beyond 160.00, a price level the pair hasn’t reached since 1990.

USD/JPY News

AUD/USD stands firm above 0.6500 with markets bracing for Aussie PPI, US inflation

AUD/USD stands firm above 0.6500 with markets bracing for Aussie PPI, US inflation

The Aussie Dollar begins Friday’s Asian session on the right foot against the Greenback after posting gains of 0.33% on Thursday. The AUD/USD advance was sponsored by a United States report showing the economy is growing below estimates while inflation picked up.

AUD/USD News

Gold soars as US economic woes and inflation fears grip investors

Gold soars as US economic woes and inflation fears grip investors

Gold prices advanced modestly during Thursday’s North American session, gaining more than 0.5% following the release of crucial economic data from the United States. GDP figures for the first quarter of 2024 missed estimates, increasing speculation that the US Fed could lower borrowing costs.

Gold News

Stripe looks to bring back crypto payments as stablecoin market cap hits all-time high

Stripe looks to bring back crypto payments as stablecoin market cap hits all-time high

Stripe announced on Thursday that it would add support for USDC stablecoin, as the stablecoin market exploded in March, according to reports by Cryptocompare.

Read more

Bank of Japan expected to keep interest rates on hold after landmark hike

Bank of Japan expected to keep interest rates on hold after landmark hike

The Bank of Japan is set to leave its short-term rate target unchanged in the range between 0% and 0.1% on Friday, following the conclusion of its two-day monetary policy review meeting for April. The BoJ will announce its decision on Friday at around 3:00 GMT.

Read more

Majors

Cryptocurrencies

Signatures