Dow down, others up [Video]
![Dow down, others up [Video]](https://editorial.fxstreet.com/images/Markets/Equities/DowJones/dow-jones-stock-indexes-7184580_XtraLarge.jpg)
US Dollar: Sep '22 USD is Up at 106.530.
Energies: Aug '22 Crude is Up at 100.48.
Financials: The Sep '22 30 Year bond is Down 5 ticks and trading at 141.00.
Indices: The Sep '22 S&P 500 emini ES contract is 32 ticks Lower and trading at 3826.00.
Gold: The Aug'22 Gold contract is trading Up at 1765.20. Gold is 13 ticks Higher than its close.
Initial conclusion
This is not a correlated market. The dollar is Up, and Crude is Up which is not normal, but the 30-year Bond is trading Lower. The Financials should always correlate with the US dollar such that if the dollar is lower, then the bonds should follow and vice-versa. The S&P is Lower, and Crude is trading Higher which is correlated. Gold is trading Higher which is not correlated with the US dollar trading Up. I tend to believe that Gold has an inverse relationship with the US Dollar as when the US Dollar is down, Gold tends to rise in value and vice-versa. Think of it as a seesaw, when one is up the other should be down. I point this out to you to make you aware that when we don't have a correlated market, it means something is wrong. As traders you need to be aware of this and proceed with your eyes wide open. Asia is trading Lower with the exception of the Indian Sensex exchange which is Higher at this time. Currently all of Europe is trading Higher.
Possible challenges to traders today
-
FOMC Member Williams Speaks at 9 AM EST. Major.
-
Final Services PMI is out at 9:45 AM EST. Major.
-
JOLTS Job Openings is out at 10 AM EST. Major.
-
ISM Services PMI is out at 10 AM EST. This is Major.
-
FOMC Meeting Minutes is out at 2 PM EST. Major.
Treasuries
Traders, please note that we've changed the Bond instrument from the 30 year (ZB) to the 10 year (ZN). They work exactly the same.
We've elected to switch gears a bit and show correlation between the 10-year bond (ZN) and the S&P futures contract. The S&P contract is the Standard and Poor's, and the purpose is to show reverse correlation between the two instruments. Remember it's likened to a seesaw, when up goes up the other should go down and vice versa.
Yesterday the ZN made its move at around 10:30 AM EST. The ZN hit a Low at around that time and the S&P moved Lower shortly thereafter. If you look at the charts below ZN gave a signal at around 10:30 AM EST and the S&P moved Lower at around the same time. Look at the charts below and you'll see a pattern for both assets. ZN hit a Low at around 10:30 AM EST and the S&P was moving Lower shortly thereafter. These charts represent the newest version of MultiCharts and I've changed the timeframe to a 15-minute chart to display better. This represented a Long opportunity on the 10-year note, as a trader you could have netted about 25 ticks per contract on this trade. Each tick is worth $15.625. Please note: the front month for the ZN is now Sep '22. The S&P contract is also Sep' 22 as well. The front months are now Sep' 22. I've changed the format to Heikin-Ashi such that it may be more apparent and visible.
Charts Courtesy of MultiCharts built on an AMP platform
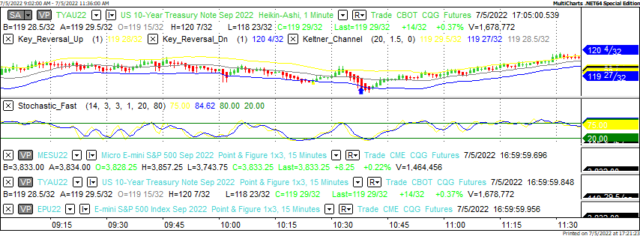
ZN - Sep 2022 - 07/05/22
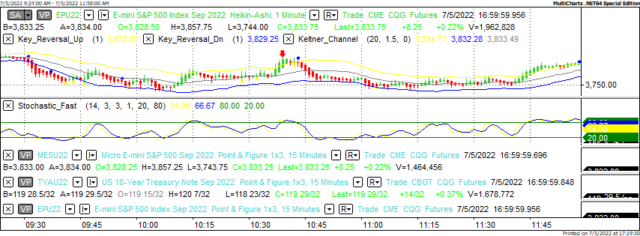
S&P - Sep 2022 - 07/05/22
Bias
Yesterday we gave the markets a Downside bias as both the USD and the Bonds were trading Higher Tuesday morning. The Dow closed Lower but the S&P and Nasdaq traded Higher. Today we aren't dealing with a correlated market and our bias is Neutral.
Could this change? Of Course. Remember anything can happen in a volatile market.
Commentary
Well yesterday we proposed a Down Day and for most of the session all the indices traded Lower. Then in the afternoon the Nasdaq veered to the Upside as did the S&P however the Dow remained in negative territory as predicted. Today we have far more news than yesterday with an FOMC member speaking, Jolts Jobs numbers which are always major and a proven market mover. Additionally crude traded below $100 dollars a barrel and that's major as well.
Author

Nick Mastrandrea
Market Tea Leaves


