Dow does it alone [Video]
![Dow does it alone [Video]](https://editorial.fxstreet.com/images/Markets/Equities/SP500/wall_street_nyse2-637299021353183737_XtraLarge.jpg)
US Dollar: Mar '22 USD is Up at 96.360.
Energies: Feb '22 Crude is Down at 75.96.
Financials: The Mar '22 30 Year bond is Down 10 ticks and trading at 160.11.
Indices: The Mar '22 S&P 500 emini ES contract is 35 ticks Higher and trading at 4787.25.
Gold: The Feb'22 Gold contract is trading Down at 1800.20. Gold is 107 ticks Lower than its close.
Initial conclusion
This is not a correlated market. The dollar is Up, and Crude is Down which is normal, but the 30-year Bond is trading Lower. The Financials should always correlate with the US dollar such that if the dollar is lower, then the bonds should follow and vice-versa. The S&P is Higher, and Crude is trading Lower which is correlated. Gold is trading Lower which is correlated with the US dollar trading Up. I tend to believe that Gold has an inverse relationship with the US Dollar as when the US Dollar is down, Gold tends to rise in value and vice-versa. Think of it as a seesaw, when one is up the other should be down. I point this out to you to make you aware that when we don't have a correlated market, it means something is wrong. As traders you need to be aware of this and proceed with your eyes wide open. Currently Asia is trading Lower with the exception of the Singapore exchange which is fractionally Higher at this time. Europe is trading Mixed at this time.
Possible challenges to traders today
-
Goods Trade Balance is out at 8:30 AM EST. This is Major.
-
Prelim Wholesale Inventories is out at 8:30 AM EST. This is Major.
-
Pending Home Sales is out at 10 AM EST. This is Major.
-
Crude Oil Inventories is out at 10:30 AM EST.
Treasuries
Traders, please note that we've changed the Bond instrument from the 30 year (ZB) to the 10 year (ZN). They work exactly the same.
We've elected to switch gears a bit and show correlation between the 10-year bond (ZN) and the S&P futures contract. The S&P contract is the Standard and Poor's, and the purpose is to show reverse correlation between the two instruments. Remember it's likened to a seesaw, when up goes up the other should go down and vice versa.
Yesterday the ZN made its move at around 8:30 AM EST. The ZN hit a Low around that time and the S&P moved Lower. If you look at the charts below ZN gave a signal at around 8:30 AM EST and the S&P moved Lower at around the same time. Look at the charts below and you'll see a pattern for both assets. ZN hit a Low at around 8:30 AM EST and the S&P was moving Lower shortly thereafter. These charts represent the newest version of MultiCharts and I've changed the timeframe to a 15-minute chart to display better. This represented a Long opportunity on the 10-year note, as a trader you could have netted about a dozen ticks per contract on this trade. Each tick is worth $15.625. Please note: the front month for the ZN is now Mar '22. The S&P contract is now Mar '22 as well. I've changed the format to Renko bars such that it may be more apparent and visible.
Charts courtesy of MultiCharts built on an AMP platform
ZN - Mar 2022 - 12/28/21
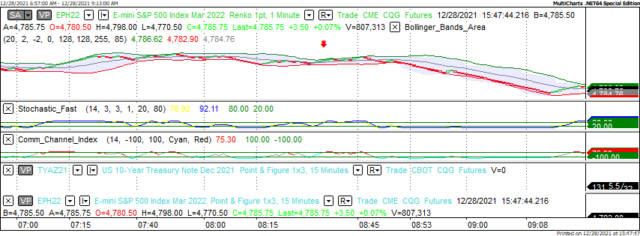
S&P - Mar 2022 - 12/28/21
Bias
Yesterday we gave the markets an Upside bias as both the USD and teh Bonds were trading Lower Tuesday morning and tis is usually indicative of an Upside Day. The markets however had other ideas as the Dow did show a gain of 96 points, but the S&P and Nasdaq did not follow thru, so we have a Neutral or Mixed market. Today we aren't dealing with a correlated market and our bias is to the Upside.
Could this change? Of Course. Remember anything can happen in a volatile market.
Commentary
Yesterday appeared to be a situation of traders wanting to take money off the table as the markets have been trading Higher as of late and no one ever lost money by taking it off the tables. I don't think th economic news reported had any bearing on the markets at all. It was simply a situation of traders (both retail and institutional) wanting to book some profits. Today we have Pending Home Sales and Crude Oil Inventories; both are major so time will tell how it affects the markets.
Author

Nick Mastrandrea
Market Tea Leaves


