Dow Bucks Trend

Good Morning Traders,
As of this writing 3:45 AM EST, here’s what we see:
US Dollar: Dec. USD is Up at 95.570.
Energies: Oct '18 Crude is Up at 74.74.
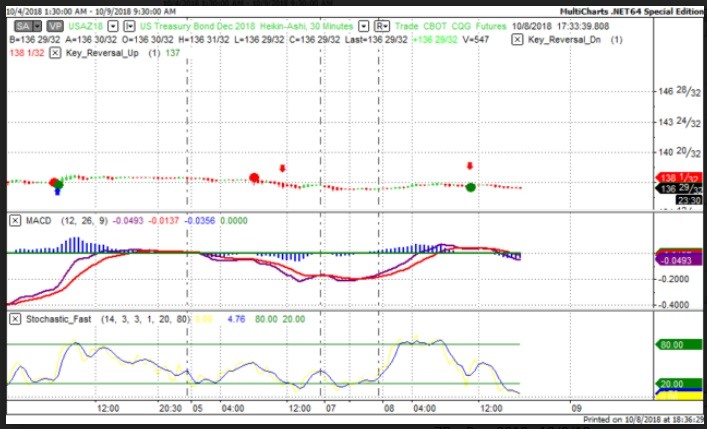
Financials: The Dec 30 year bond is Down 10 ticks and trading at 136.23.
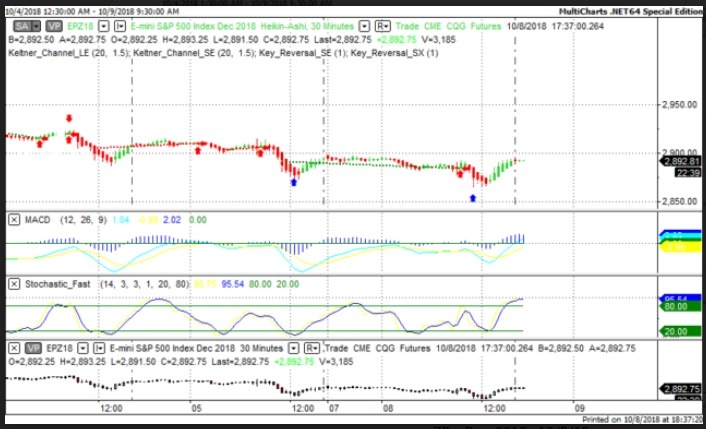
Indices: The Dec S&P 500 emini ES contract is 18 ticks Lower and trading at 2889.25.
Gold: The Dec Gold contract is trading Up at 1192.60. Gold is 40 ticks Lower than its close.
Initial Conclusion
This is not a correlated market. The dollar is Up+ and Crude is Up+ which is not normal and the 30 year Bond is trading Lower. The Financials should always correlate with the US dollar such that if the dollar is lower then bonds should follow and vice-versa. The S&P is Lower and Crude is trading Higher which is correlated. Gold is trading Up+ which is not correlated with the US dollar trading Higher. I tend to believe that Gold has an inverse relationship with the US Dollar as when the US Dollar is down, Gold tends to rise in value and vice-versa. Think of it as a seesaw, when one is up the other should be down. I point this out to you to make you aware that when we don't have a correlated market, it means something is wrong. As traders you need to be aware of this and proceed with your eyes wide open.
At this hour Asia is trading mainly Lower with the exception of the Shanghai exchange which is fractionally Higher. Currently all of Europe is trading Higher.
Possible Challenges To Traders Today
-
NFIB Small Business Index is out at 6 AM EST. Major.
-
IBD/TIPP Economic Optimism is out at 10 AM EST. Major.
Treasuries
We've elected to switch gears a bit and show correlation between the 30 year bond (ZB) and The YM futures contract. The YM contract is the DJIA and the purpose is to show reverse correlation between the two instruments. Remember it's liken to a seesaw, when up goes up the other should go down and vice versa.
Yesterday the ZB made it's move at around 11:30 AM EST. The ZB hit a High at around that time and the YM hit a Low. If you look at the charts below ZB gave a signal at around 11:30 AM EST and the YM was moving Higher at the same time. Look at the charts below and you'll see a pattern for both assets. ZB hit a High at around 11:30 AM and the YM was moving Higher at the same time. These charts represent the newest version of MultiCharts and I've changed the timeframe to a 30 minute chart to display better. This represented a Long opportunity on the 30 year bond, as a trader you could have netted about a dozen ticks per contract on this trade. Each tick is worth $31.25.
Charts Courtesy of MultiCharts built on an AMP platform.
Bias
Yesterday we gave the markets a Neutral bias as all the instruments we track was pointed Lower and the markets had no sense of direction, hence the Neutral bias. The Dow gained 40 points however the other indices lost ground. Today we aren't dealing with a correlated market and our bias is to the Downside.
Could this change? Of Course. Remember anything can happen in a volatile market.
Commentary
Yesterday morning all the instruments we track was pointed Lower. Whenever you have a situation whereby everything is pointed Lower or conversely everything is pointed Higher, you have no correlation and no sense of direction. Hence the Neutral bias. A Neutral bias means the markets could go in any direction and often does. Yesterday the markets remained solidly negative until after 2 PM EST when the Dow started to rise. Will we see a brighter day today? Only time will tell.....
Author

Nick Mastrandrea
Market Tea Leaves


