Dow Advances Despite Trump

Good Morning Traders,
As of this writing 4 AM EST, here’s what we see:
US Dollar: Sept. USD is Down at 93.420.
Energies: Sept Crude is Up at 46.91.
Financials: The Sept 30 year bond is Down 5 ticks and trading at 154.29.
Indices: The Sept S&P 500 emini ES contract is 4 ticks Lower and trading at 2466.50.
Gold: The Dec gold contract is trading Up at 1294.10. Gold is 112 ticks Higher than its close.
Initial Conclusion
This is not a correlated market. The dollar is Down- and Crude is Up+ which is normal and the 30 year Bond is trading Lower. The Financials should always correlate with the US dollar such that if the dollar is lower then bonds should follow and vice-versa. The indices are Down- and Crude is trading Up+ which is correlated. Gold is trading Down which is not correlated with the US dollar trading Down-. I tend to believe that Gold has an inverse relationship with the US Dollar as when the US Dollar is down, Gold tends to rise in value and vice-versa. Think of it as a seesaw, when one is up the other should be down. I point this out to you to make you aware that when we don’t have a correlated market, it means something is wrong. As traders you need to be aware of this and proceed with your eyes wide open.
At this hour Asia is trading mixed with half the exchanges trading Higher and the other half Lower. At this hour Europe is trading Mixed as well.
Possible Challenges To Traders Today
– Unemployment Claims are out at 8:30 AM EST. This is major
– Philly Fed Mfg Index is out at 8:30 AM EST. This is major.
Capacity Utilization Rate is out at 9:15 AM EST. This is not major.
Industrial Production m/m is out at 9:15 AM. This is not major.
CB Leading Index m/m is out at 10 AM EST. This is major.
– Natural Gas Storage is out at 10:30 AM EST. This is major.
– FOMC Member Kaplan Speaks at 12:30 PM . This is major.
Treasuries
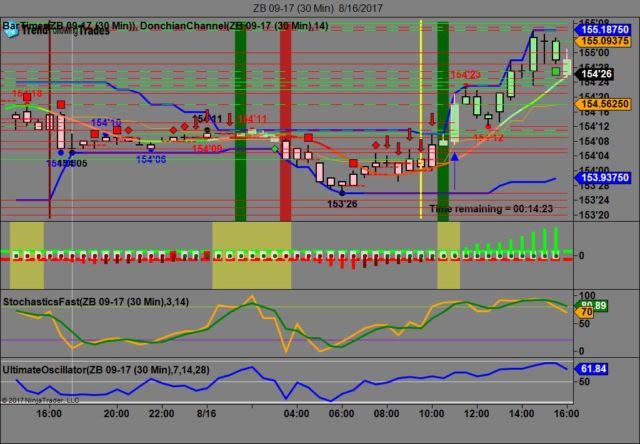
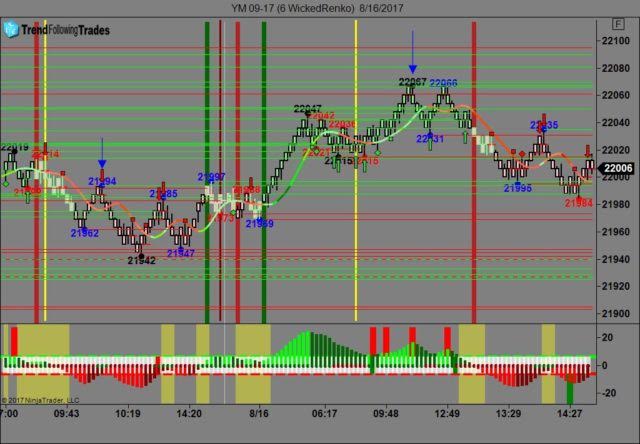
We’ve elected to switch gears a bit and show correlation between the 30 year bond (ZB) and The YM futures contract. The YM contract is the DJIA and the purpose is to show reverse correlation between the two instruments. Remember it’s liken to a seesaw, when up goes up the other should go down and vice versa.
Yesterday the ZB made it’s move at around 11 AM EST after the economic news was reported. The ZB hit a Low at around that time and the YM hit a High. If you look at the charts below ZB gave a signal at around 11 AM and the YM was moving Lower at the same time. Look at the charts below and you’ll see a pattern for both assets. ZB hit a Low at around 11 AM and the YM hit a High. These charts represent the newest version of Trend Following Trades and I’ve changed the timeframe to a 30 minute chart to display better. This represented a long opportunity on the 30 year bond, as a trader you could have netted about 30 plus ticks per contract on this trade. Each tick is worth $31.25. We added a Donchian Channel to the charts to show the signals more clearly. Please note that the front month for the ZB contract is now September, 2017.
Charts Courtesy of Trend Following Trades built on a NinjaTrader platform.
Bias
Yesterday we gave the markets an upside bias as the USD, Bonds and Gold were all trading lower yesterday morning and this does bode well for an upside day. The Dow closed higher by 26 points and the other indices closed higher as well. Today we aren’t dealing with a correlated market and our bias is Neutral.
Could this change? Of Course. Remember anything can happen in a volatile market.
Commentary
On Tuesday evening President Trump again made comments changing his position on the events in Charlottesville, VA over the weekend. On Monday he condemned the KKK, Racist groups, etc. and on Tuesday he claimed both parties were to blame. There’s only one problem with this theory: the left didn’t kill anyone on the far right and that changes everything. Apparently Trump doesn’t see it that way and now members of his council on economic development are leaving en mass. So much for job creation, I guess Trump will have to go it alone. From our perspective we will just continue to follow our rules on Market Correlation which even with this political intrigue is still proving accurate.
Author

Nick Mastrandrea
Market Tea Leaves


