Don’t be misled by gold’s recent upswing

Despite gold’s latest move higher, its outlook remains bearish. If its 2012-2013 pattern is to repeat, it means gold is now preparing for a big fall.
Patience advised
Gold moved higher on Friday, so you might be wondering if this changed anything regarding the outlook. In short, it didn’t.
Let’s take a closer look at what happened.
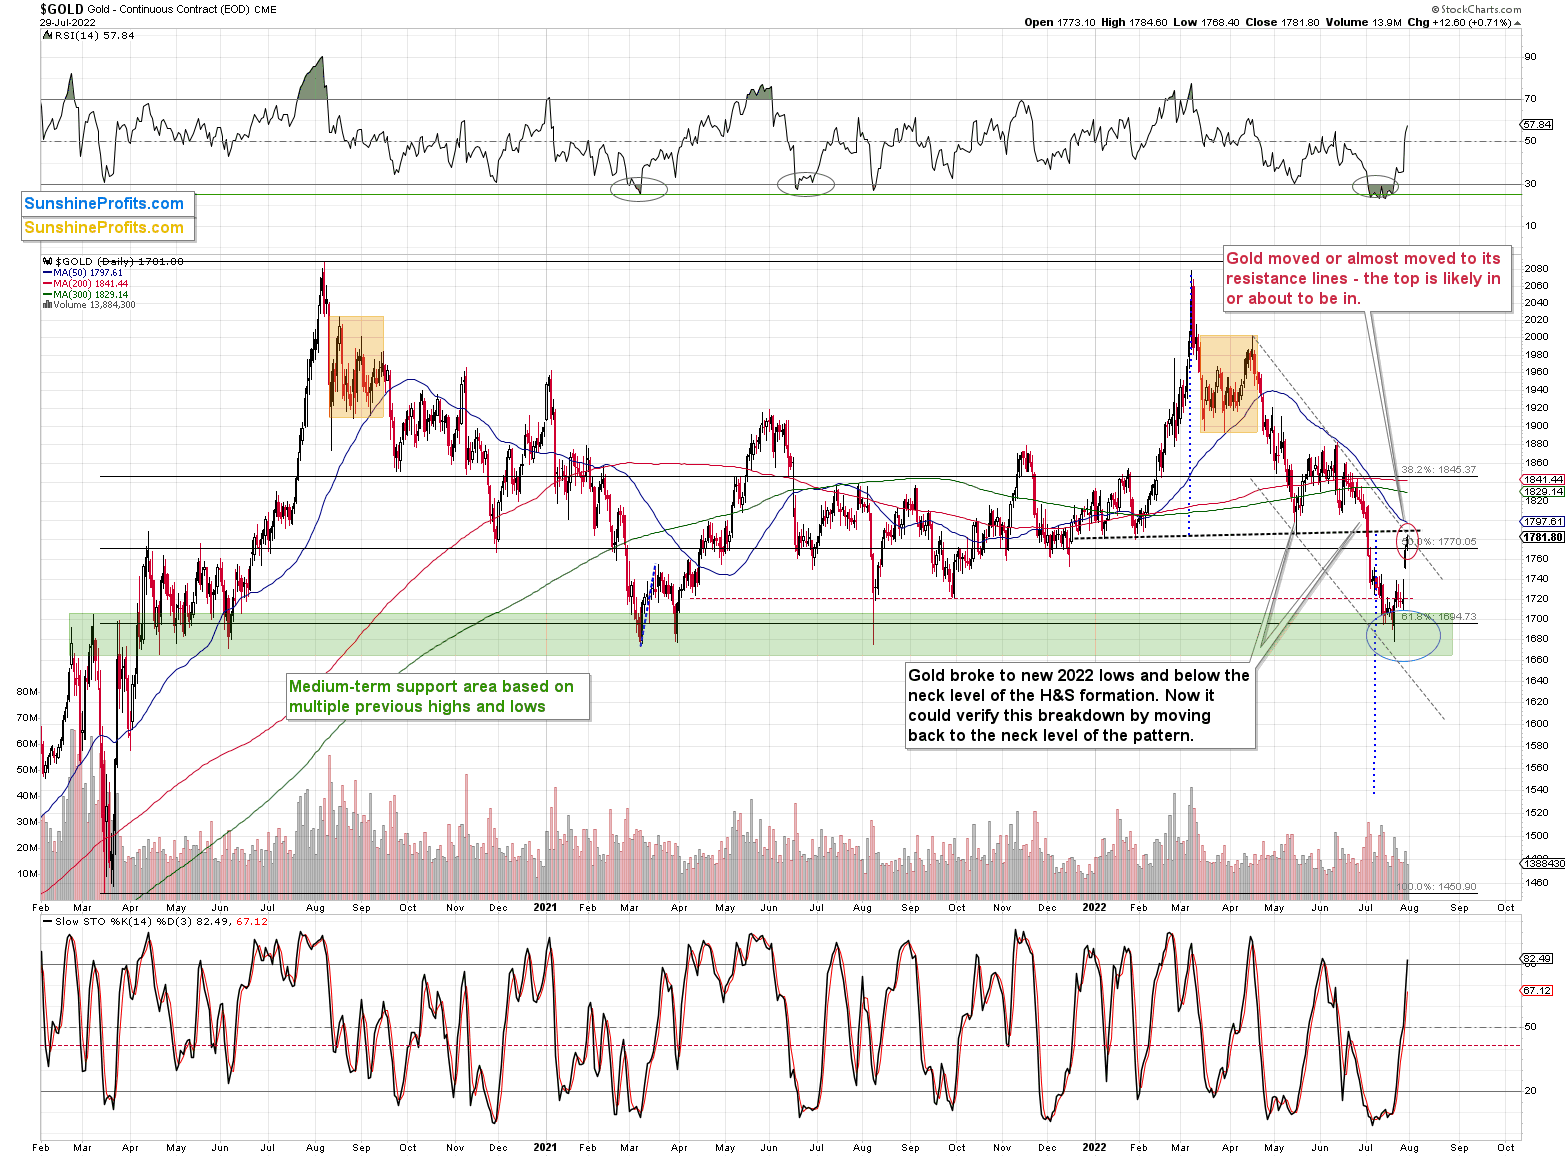
Gold futures moved higher by over $12, and this meant that they moved from the lower part of my previous target area to its upper part. In other words, it remained within the target area, which means that it kept doing what was – in my view – the most likely course of action for this particular market.
As such, it didn’t invalidate any previous expectations, let alone the broader outlook.
Gold stopped below the upper border of the declining trend channel, and it ended the week below the neck level of the previous head-and-shoulders pattern. Both remain unbroken, so the recent upswing doesn’t change the outlook, which turned bearish when we took profits from our previous long position on Thursday.
The RSI indicator is now visibly above 50 and close to the levels that triggered a top in gold in April and June 2022, and in July 2021.
As you may recall, gold is currently repeating its 2012-2013 pattern, and based on it, it’s likely just before the most volatile part of the decline. You can read more about it in Friday’s analysis (and in many previous analyses), and if the above is new to you, I strongly suggest that you take the time to read more – the self-similar pattern is truly astonishing.
So, let’s check what gold did in 2013 at the analogous time.
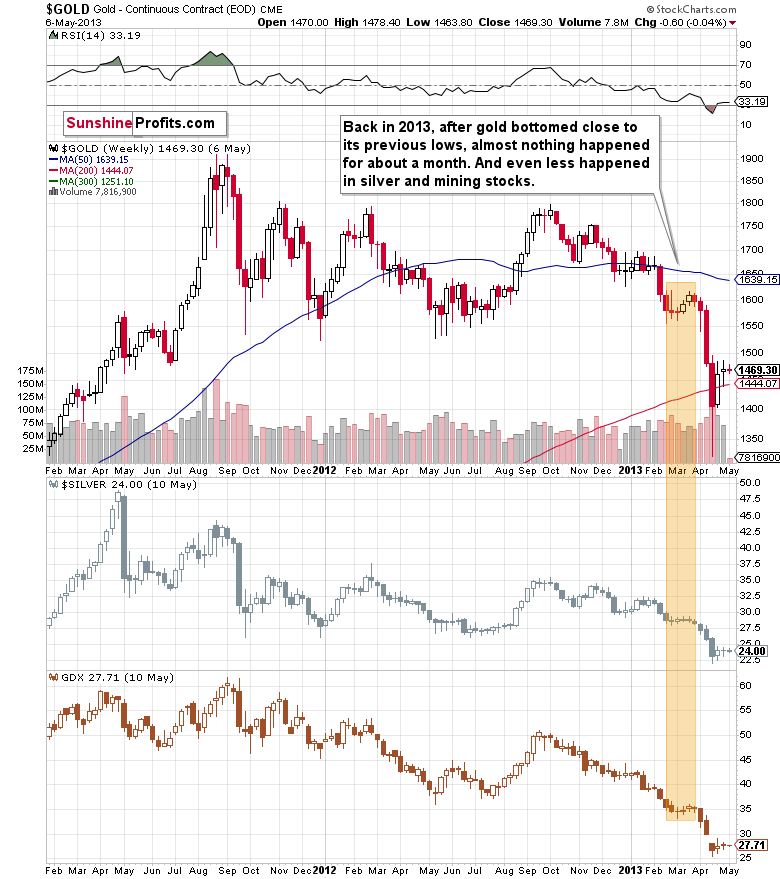
Well, it consolidated for a few weeks and plunged only after that consolidation.
While it doesn’t guarantee that we’ll see a pause that’s as long as the one that we saw before the April 2013 slide, it’s a good indication that the huge decline might not start immediately, but rather we might see some “preparatory” action.
Back and forth
For now, investors and traders might view the current prices as temporary, and they might expect gold to soar back up. In fact, I saw multiple analyses indicating exactly that. This means that a week or a few weeks of back and forth trading close to the current price levels or between the current price levels and the recent lows would help to convince them that this move lower was not accidental.
This would make them much more likely to sell (and panic) once gold breaks below its recent lows.
Also, while the above chart doesn’t show it, because it’s based on weekly and not daily prices, gold topped in March 2013 when its daily RSI was trading just a little above 50 and close to its previous higs – just like what we see right now.
Getting back to the possible back-and-forth movement that we might see now, please note that the price “action” was even more boring in the case of silver and mining stocks (middle and lower parts of the above chart). They did very little during the consolidation, but when they finally moved lower, they truly plunged.
Oh, and don’t let the sizes of the moves fool you – the scale is linear in the case of silver and GDX, while it’s logarithmic in the case of gold. In reality, the mining stocks still declined the most, and silver’s decline was still bigger than the one seen in gold.
All in all, the short-term rally appears to be over or about to be over, and mining stocks’ lack of strength on Friday confirms it.
Want free follow-ups to the above article and details not available to 99%+ investors? Sign up to our free newsletter today!
Want free follow-ups to the above article and details not available to 99%+ investors? Sign up to our free newsletter today!
Author

Przemyslaw Radomski, CFA
Gold Price Forecast
Przemyslaw Radomski, CFA (PR) is a precious metals investor and analyst who takes advantage of the emotionality on the markets, and invites you to do the same. His company, Sunshine Profits, publishes analytical software that any


