Dollar's rebound on the brink: Will DXY surge past 100 and redefine FX trends?

As US yields climb and trade tensions simmer, key FX pairs and gold brace for a fresh battle of supply and demand.
DXY recuperation faces tariff headwinds
Technical setup: After bottoming at 97.68, the DXY reclaimed the 97-85 and 98-18 base in a four-hour supply zone. This higher-low, higher-high structure pierced the three-month bearish trend last week, setting sights on the 100.00 psychological level and the critical 100.81 resistance zone. Momentum oscillators on the H4 chart show a bullish MACD crossover above the zero line, while the 14-period RSI has climbed above 55, indicating strengthening upward momentum. Price has also closed above the 20- and 50-period EMAs, which have turned upward, confirming a shift in the medium-term trend. Volume on the rally exceeds the average H4 volume by 15%, suggesting institutional participation. Traders should watch for a retest of the broken downtrend line around 99-50 and 99-60 for potential buy entries, with confluence at the 50% Fibonacci retracement of the March–May range at 99.55.
Fundamental drivers:
- Fed yield differential: U.S. 10‑year yields have rallied above 3.9%, widening the gap against the Eurozone's 2.8%, attracting hot money into dollar bonds.
- Tariff dynamics: Ongoing tariff negotiations with China and the EU remain unresolved, keeping risk assets jittery and bolstering demand for safe‑haven dollars.
- Economic data pulse: Mixed Q1 GDP and persistent core CPI near 3.4% reinforce the Fed's hawkish stance, supporting higher real yields.
Key levels:
- Bullish break: Close above 100.81 → targets at 101.30, 101.65.
- Bearish reversal: Drop below 99-90 → retest 99.60, 99.00.
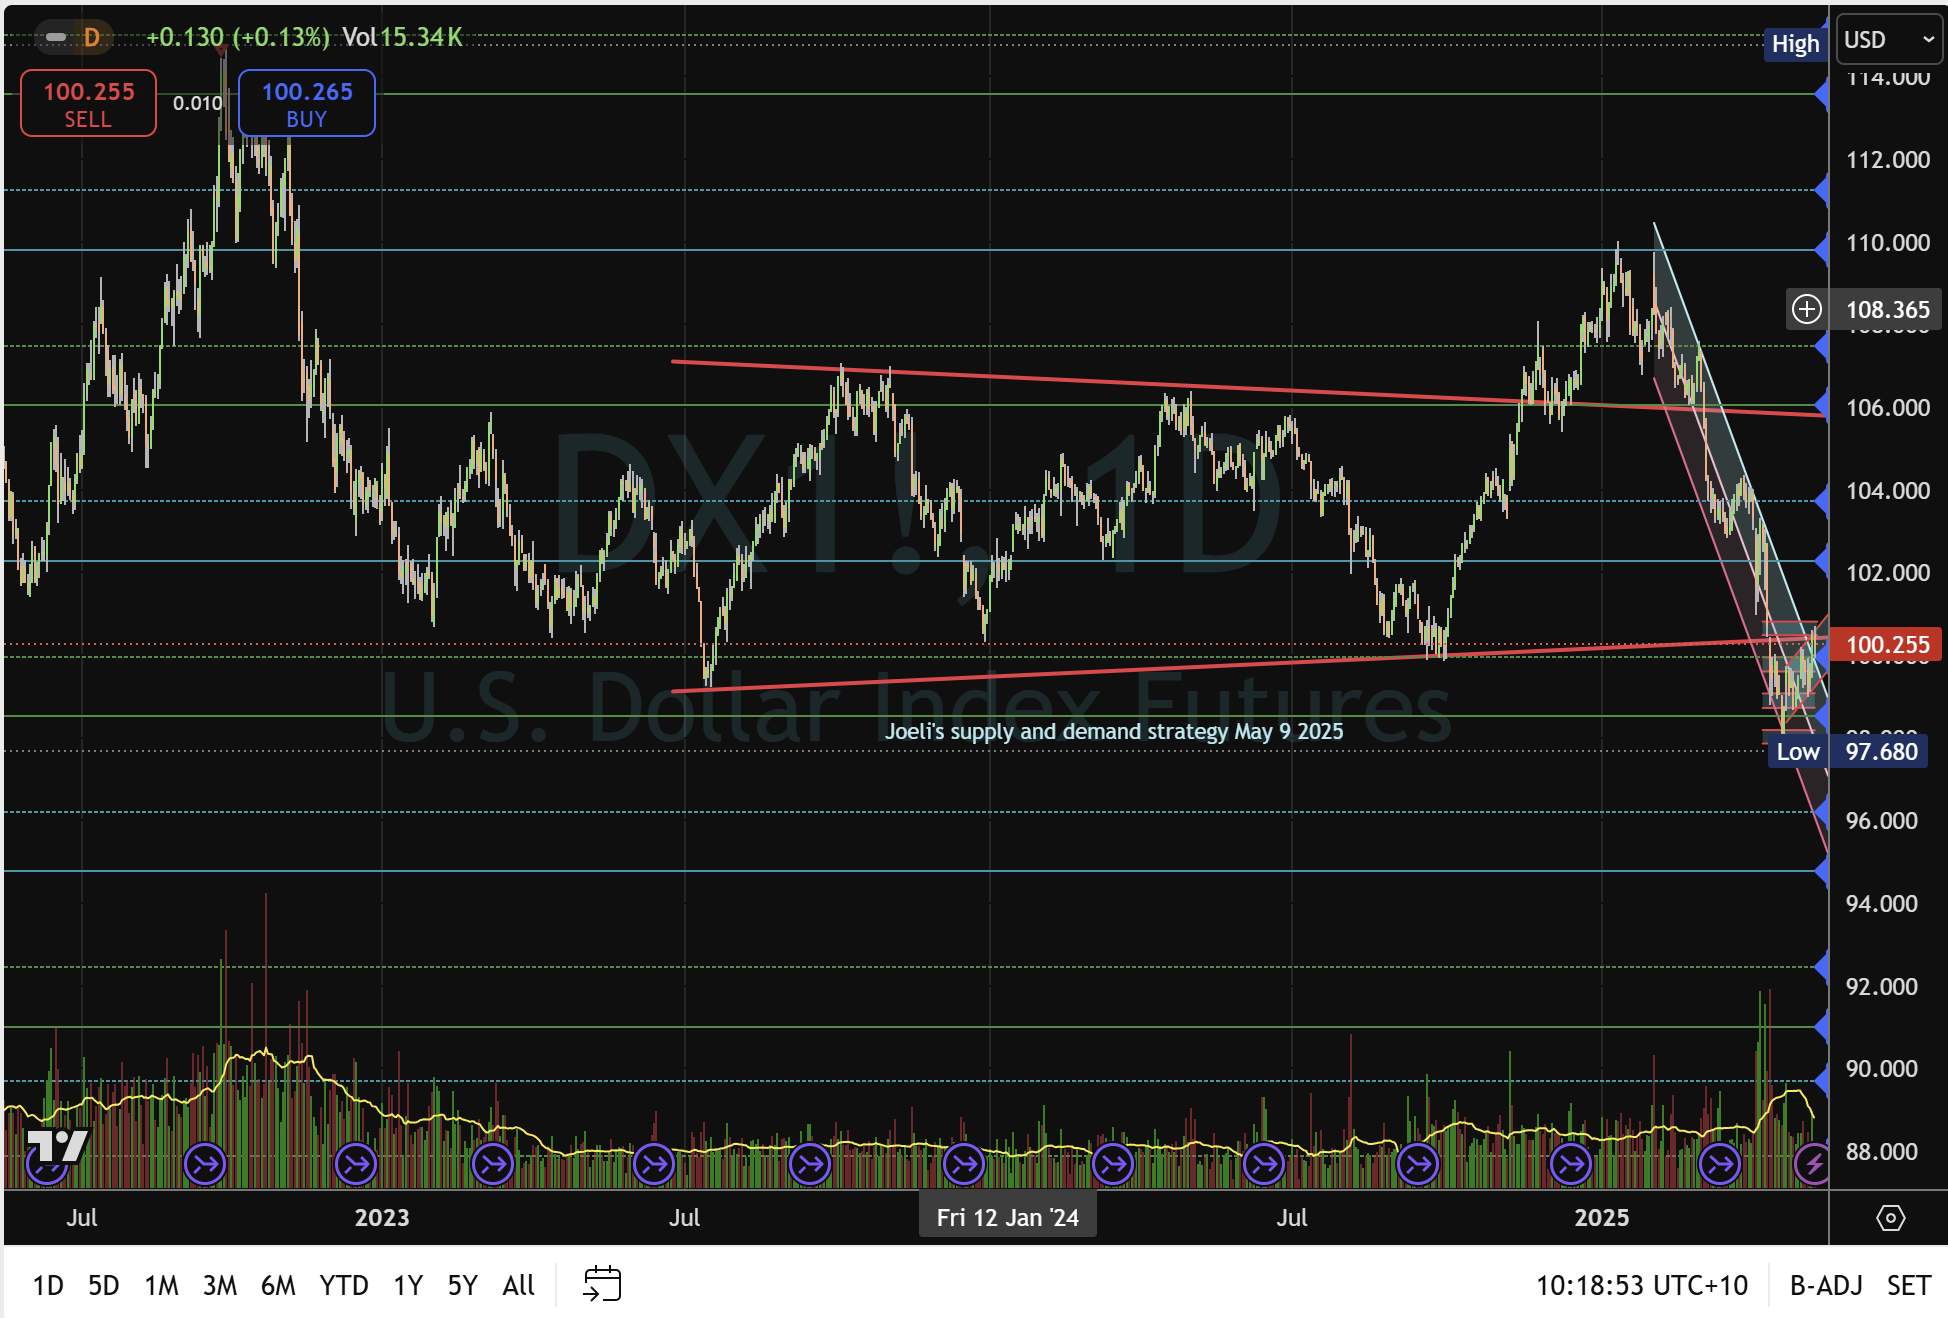
DXY daily chart
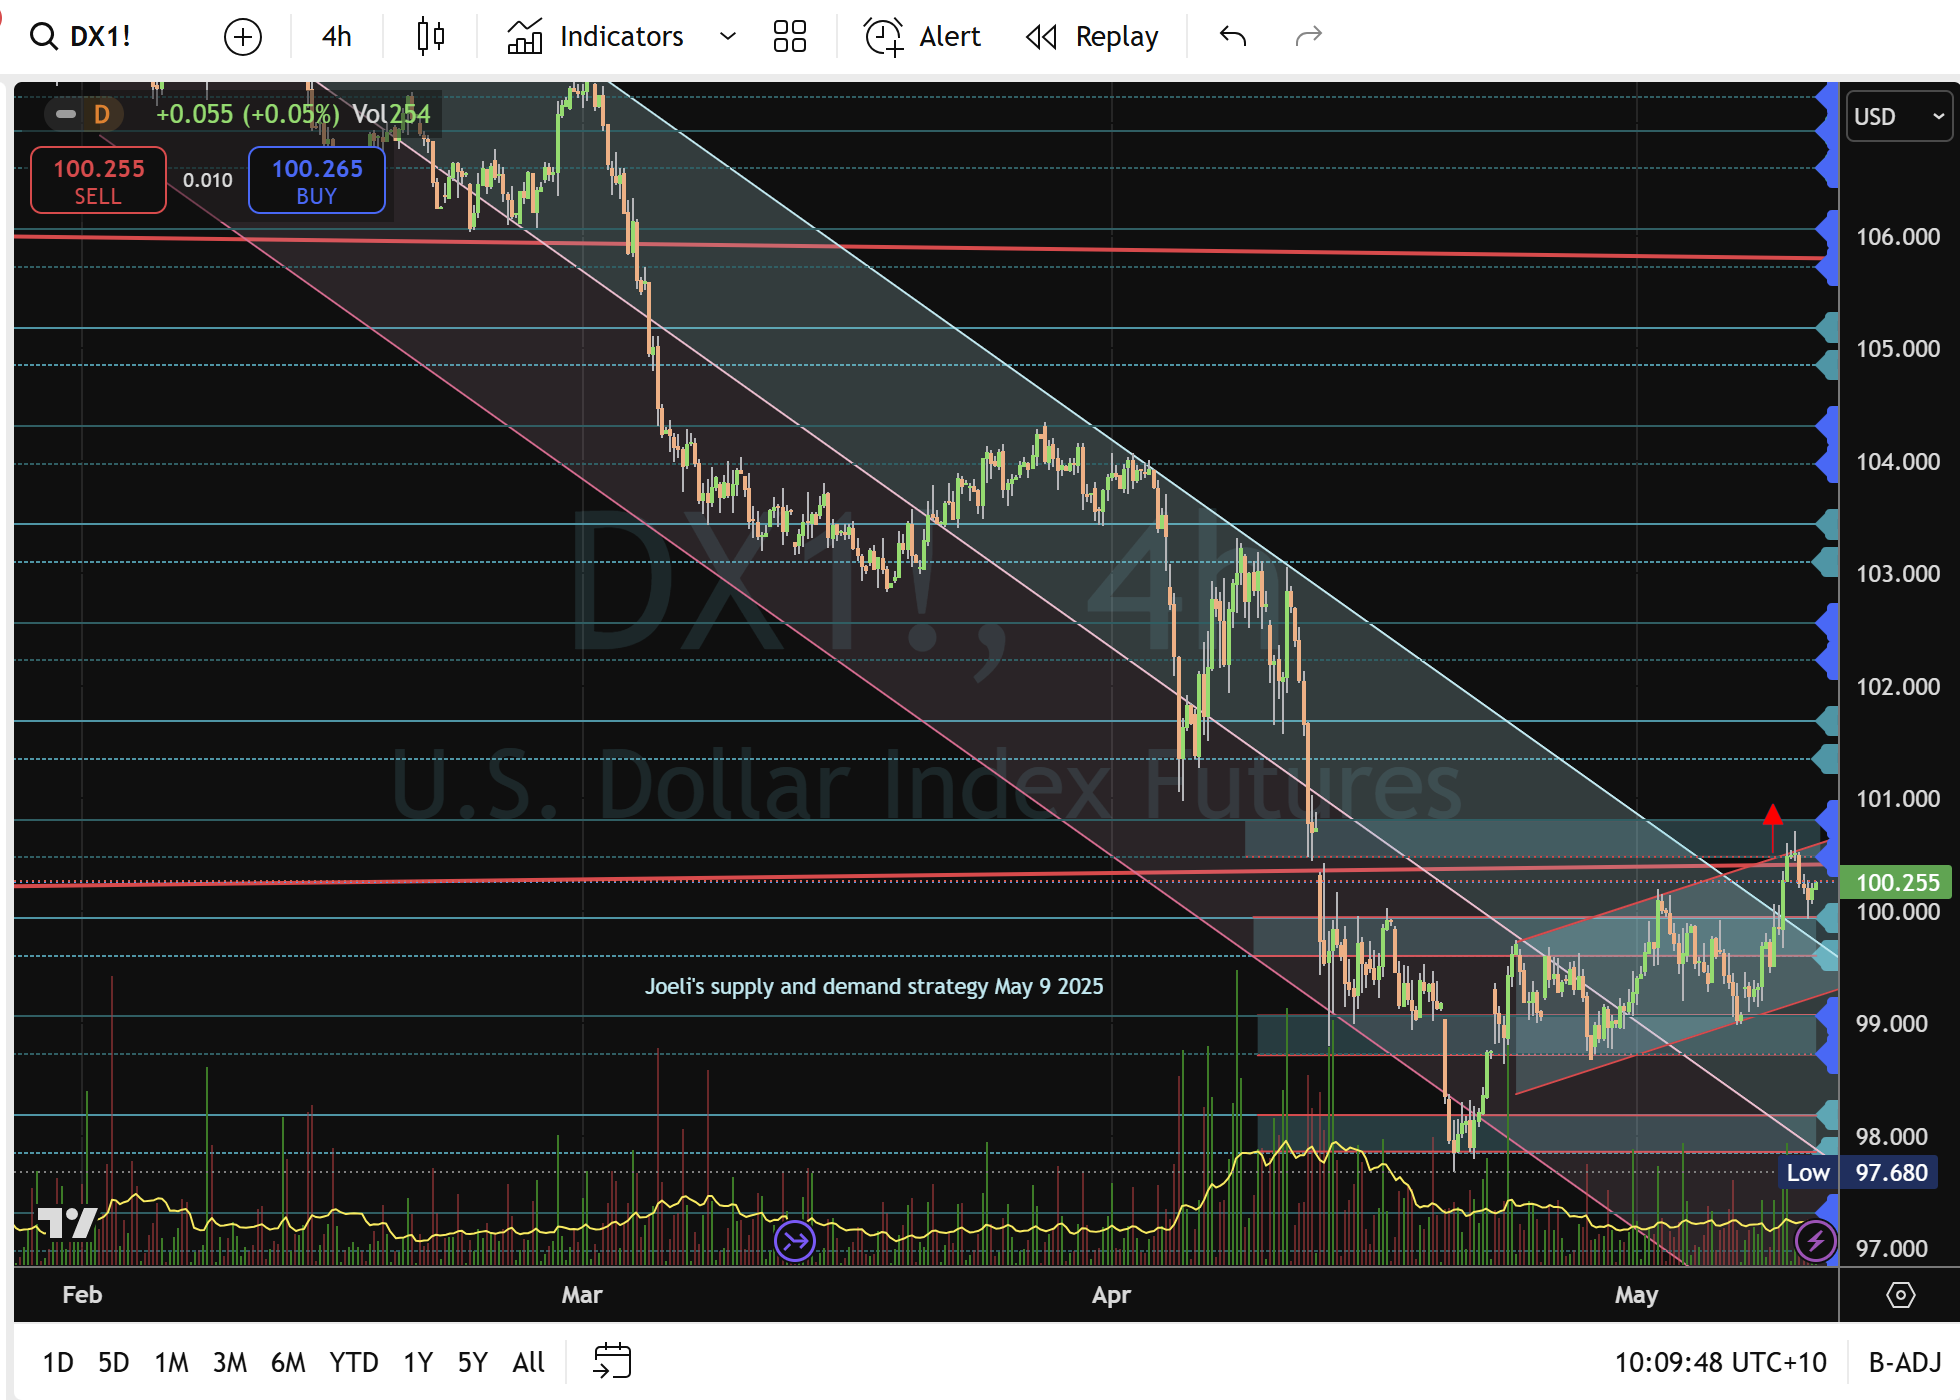
DXY H4 chart
EUR/USD: exhaustion after triple rally
Technical setup: The Euro surged to 1.1500 on DXY's weakness, then rolled over for three weekly losses, slipping below the long-standing 1.1200 S/R line and now consolidating beneath 1.1320. On the four-hour chart, EUR/USD has formed a bearish weekly candle engulfing the prior week's gains, and a broken ascending trendline at 1.1380 now acts as resistance. The 50% Fibonacci retracement of the rally from 1.1120 to 1.1500 sits at 1.1310, aligning with the 100-period EMA, reinforcing the 1.1320 barrier. RSI on H4 is rolling over from overbought territory, while on the weekly timeframe, stochastic readings show a bearish crossover, signalling further downside risk.
Fundamental drivers:
- ECB outlook: Eurozone inflation, at 2.6%, lags behind the Fed, prompting market bets on ECB rate cuts in Q4, which would pressurise the Euro.
- Trade tensions: Germany's export‑heavy economy faces increased risk of U.S. auto tariffs, which is a headwind for EUR/USD.
- Risk sentiment: Any dollar safe‑haven bid tends to amplify euro weakness.
Key levels:
- Upside crossover: Sustain above 1.1320 → reclaim bullish trend.
- Breakdown risk: Fall below 1.1260 → targets 1.1120.
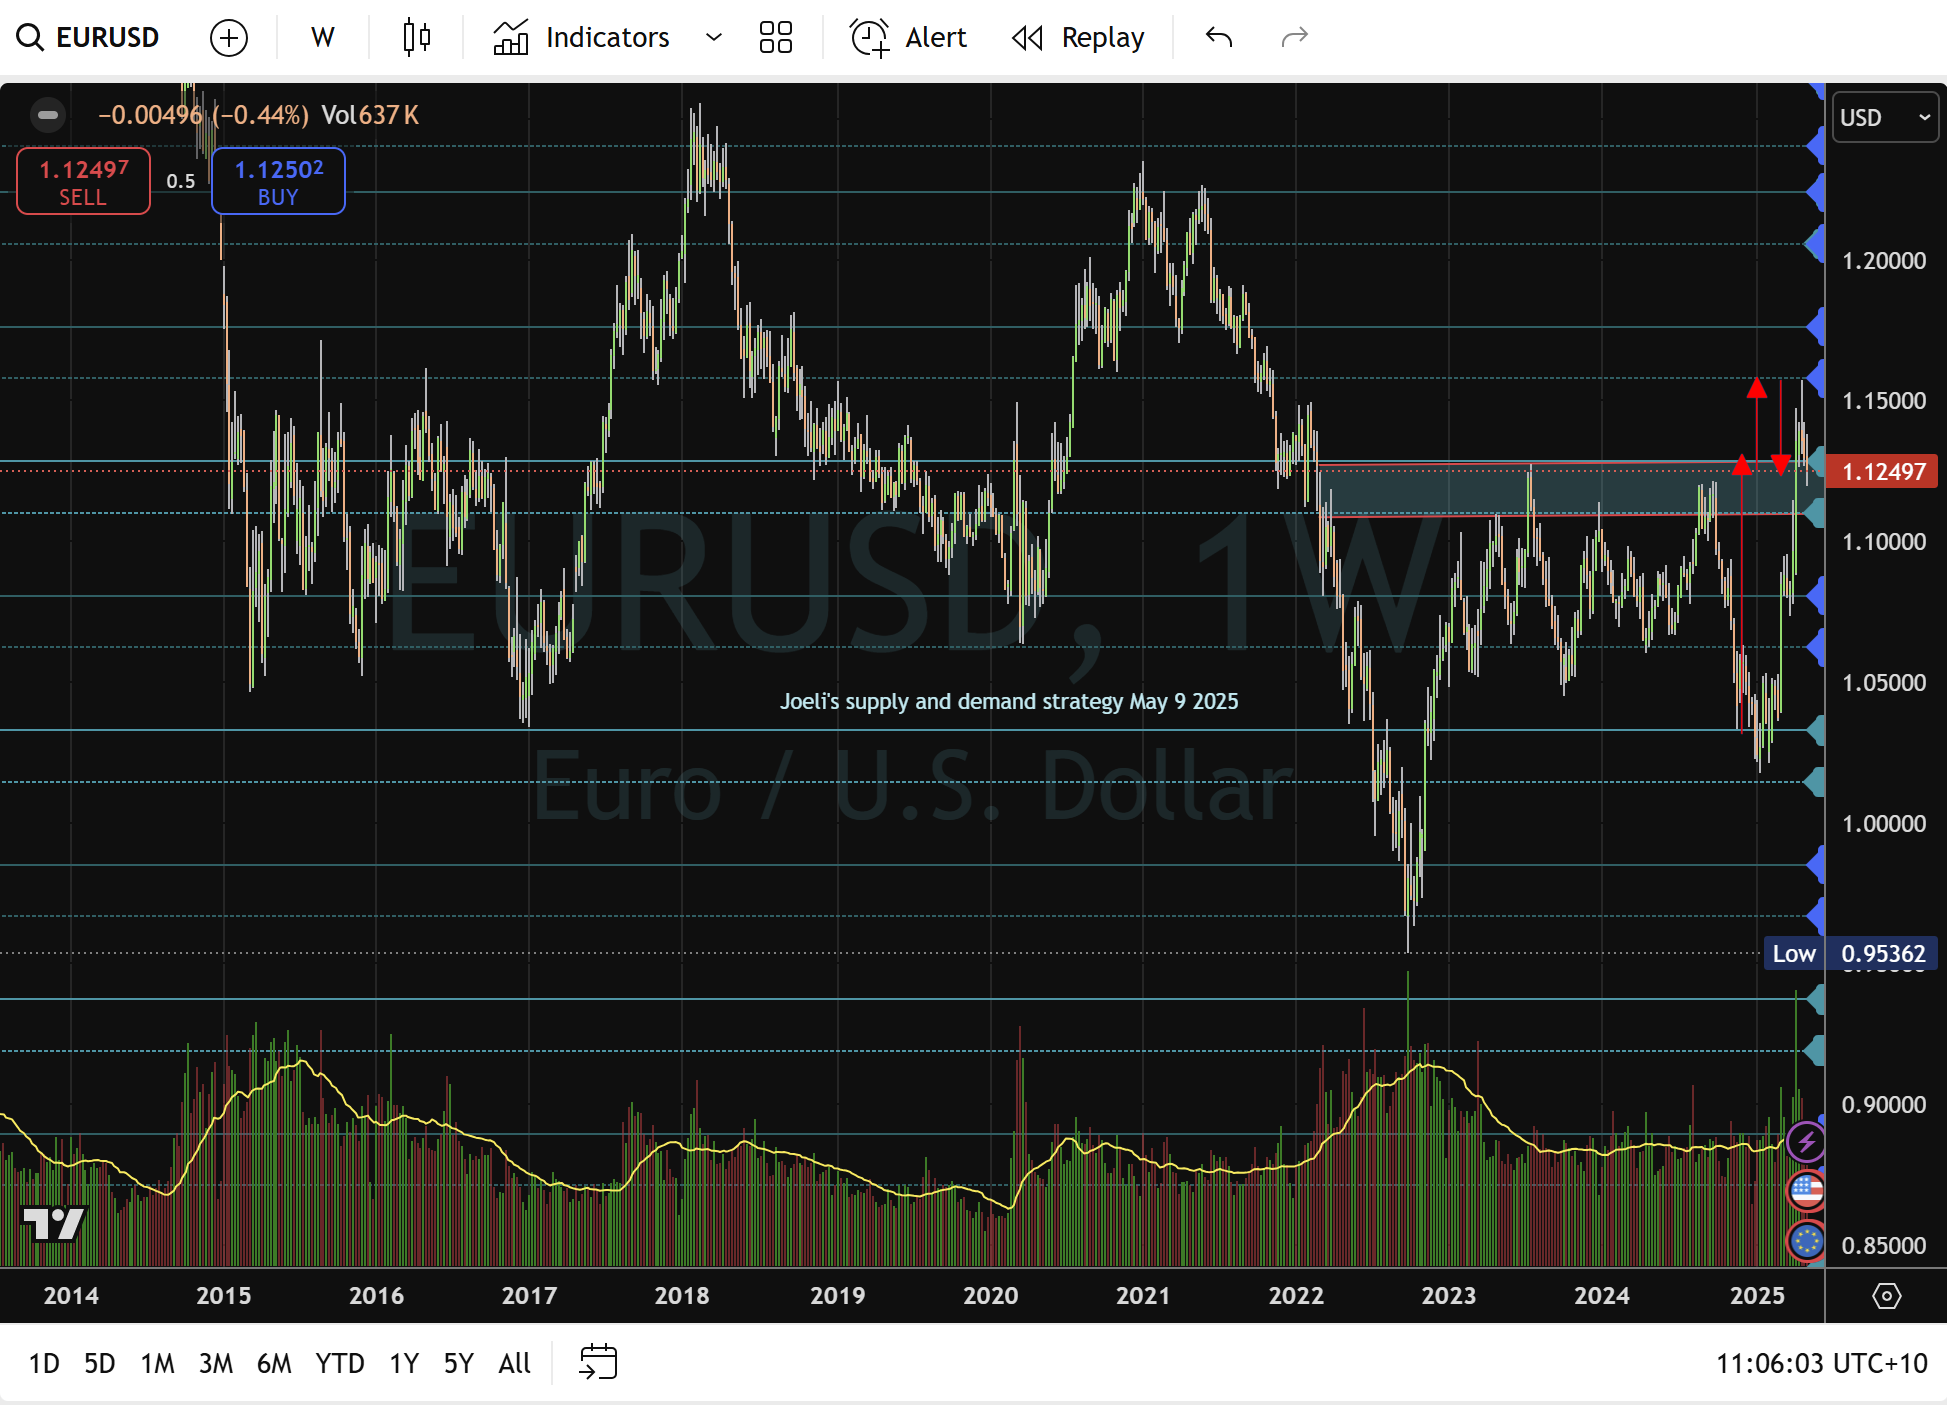
EUR/USD weekly chart
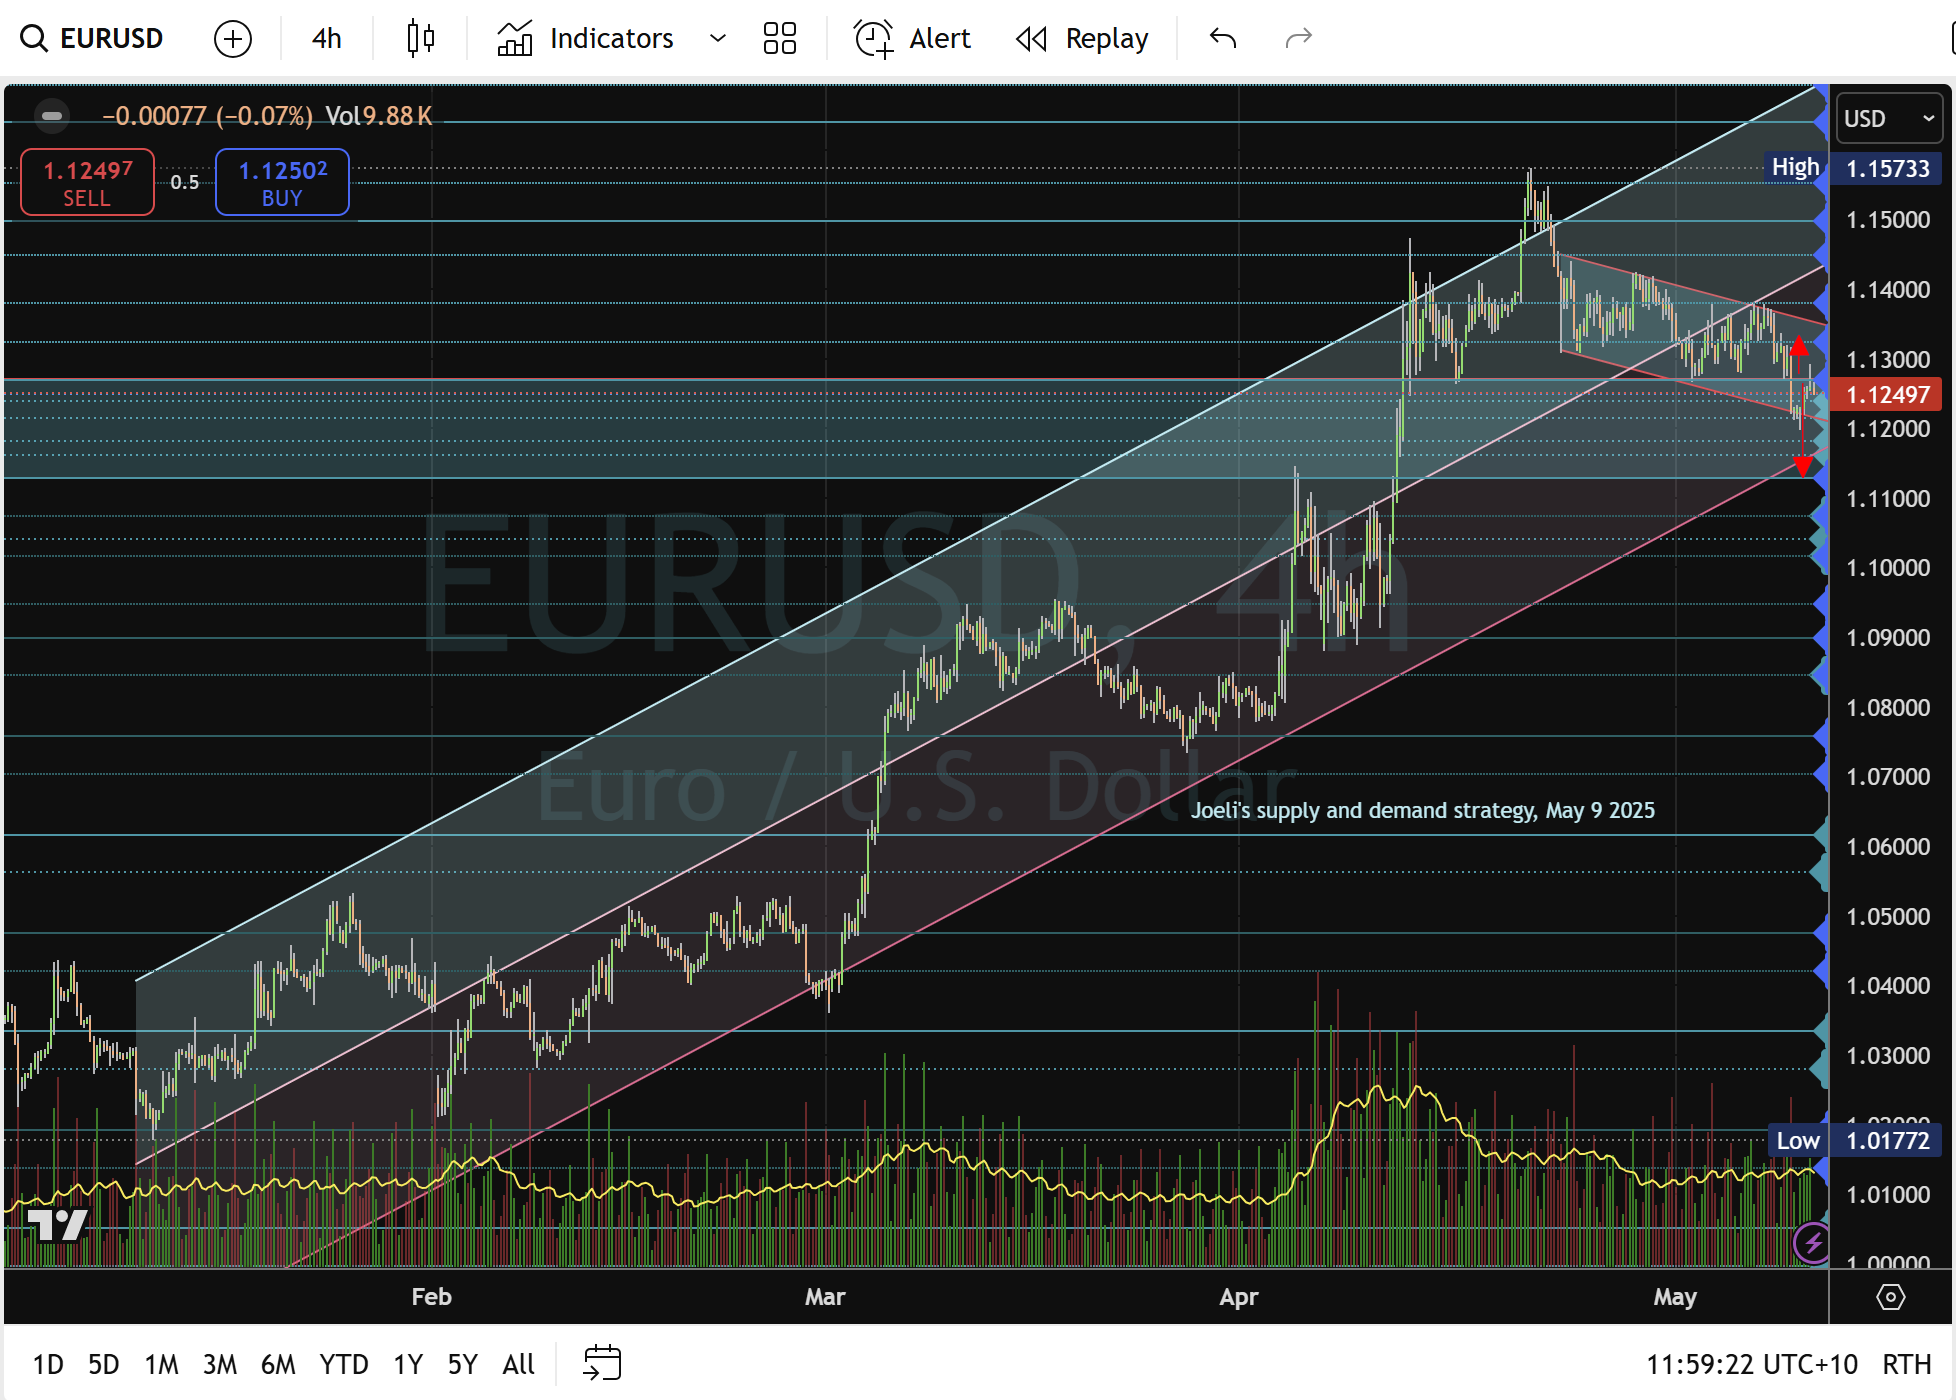
EUR/USD H4 chart
USD/JPY: rising wedge holds-but how long?
Technical setup: Weekly price action held the 139.92–140.00 support, fueling three straight weekly gains to 145.36. A 5-year rising wedge remains intact, while the 2-hour chart shows fresh higher highs and higher lows. The daily chart shows USD/JPY forming a series of long-bodied bullish candles, breaking above the descending channel from April. A confirmed break and close above the 144.50 trendline signals continuation; conversely, a failure to hold above this level may lead to a pullback to the 200-day SMA at 142.80. H4 momentum indicators, including a rising ADX above 25, confirm the strength of the current uptrend. Watch for a volume spike - May 7 saw 20% above the 20-day average, indicating strong buyer conviction.
Fundamental drivers:
- Boj divergence: Japan's ultra‑loose policy versus Fed hawkishness propels long U.S. yield/JPY carry trades.
- Intervention watch: JPY weakness near 146.00 historically triggers Boj/MinFin verbal or market intervention, capping upside.
- Trade flow: Japanese exporters may repatriate USD proceeds, adding volatility around quarter‑end.
Key levels:
- Support watch: 144.95–144.47 → break triggers 143.70, 143.20, 142.40.
- Upside break: Above 145.72–146.20 → targets 146.98, 147.46, 148.20, 148.70.
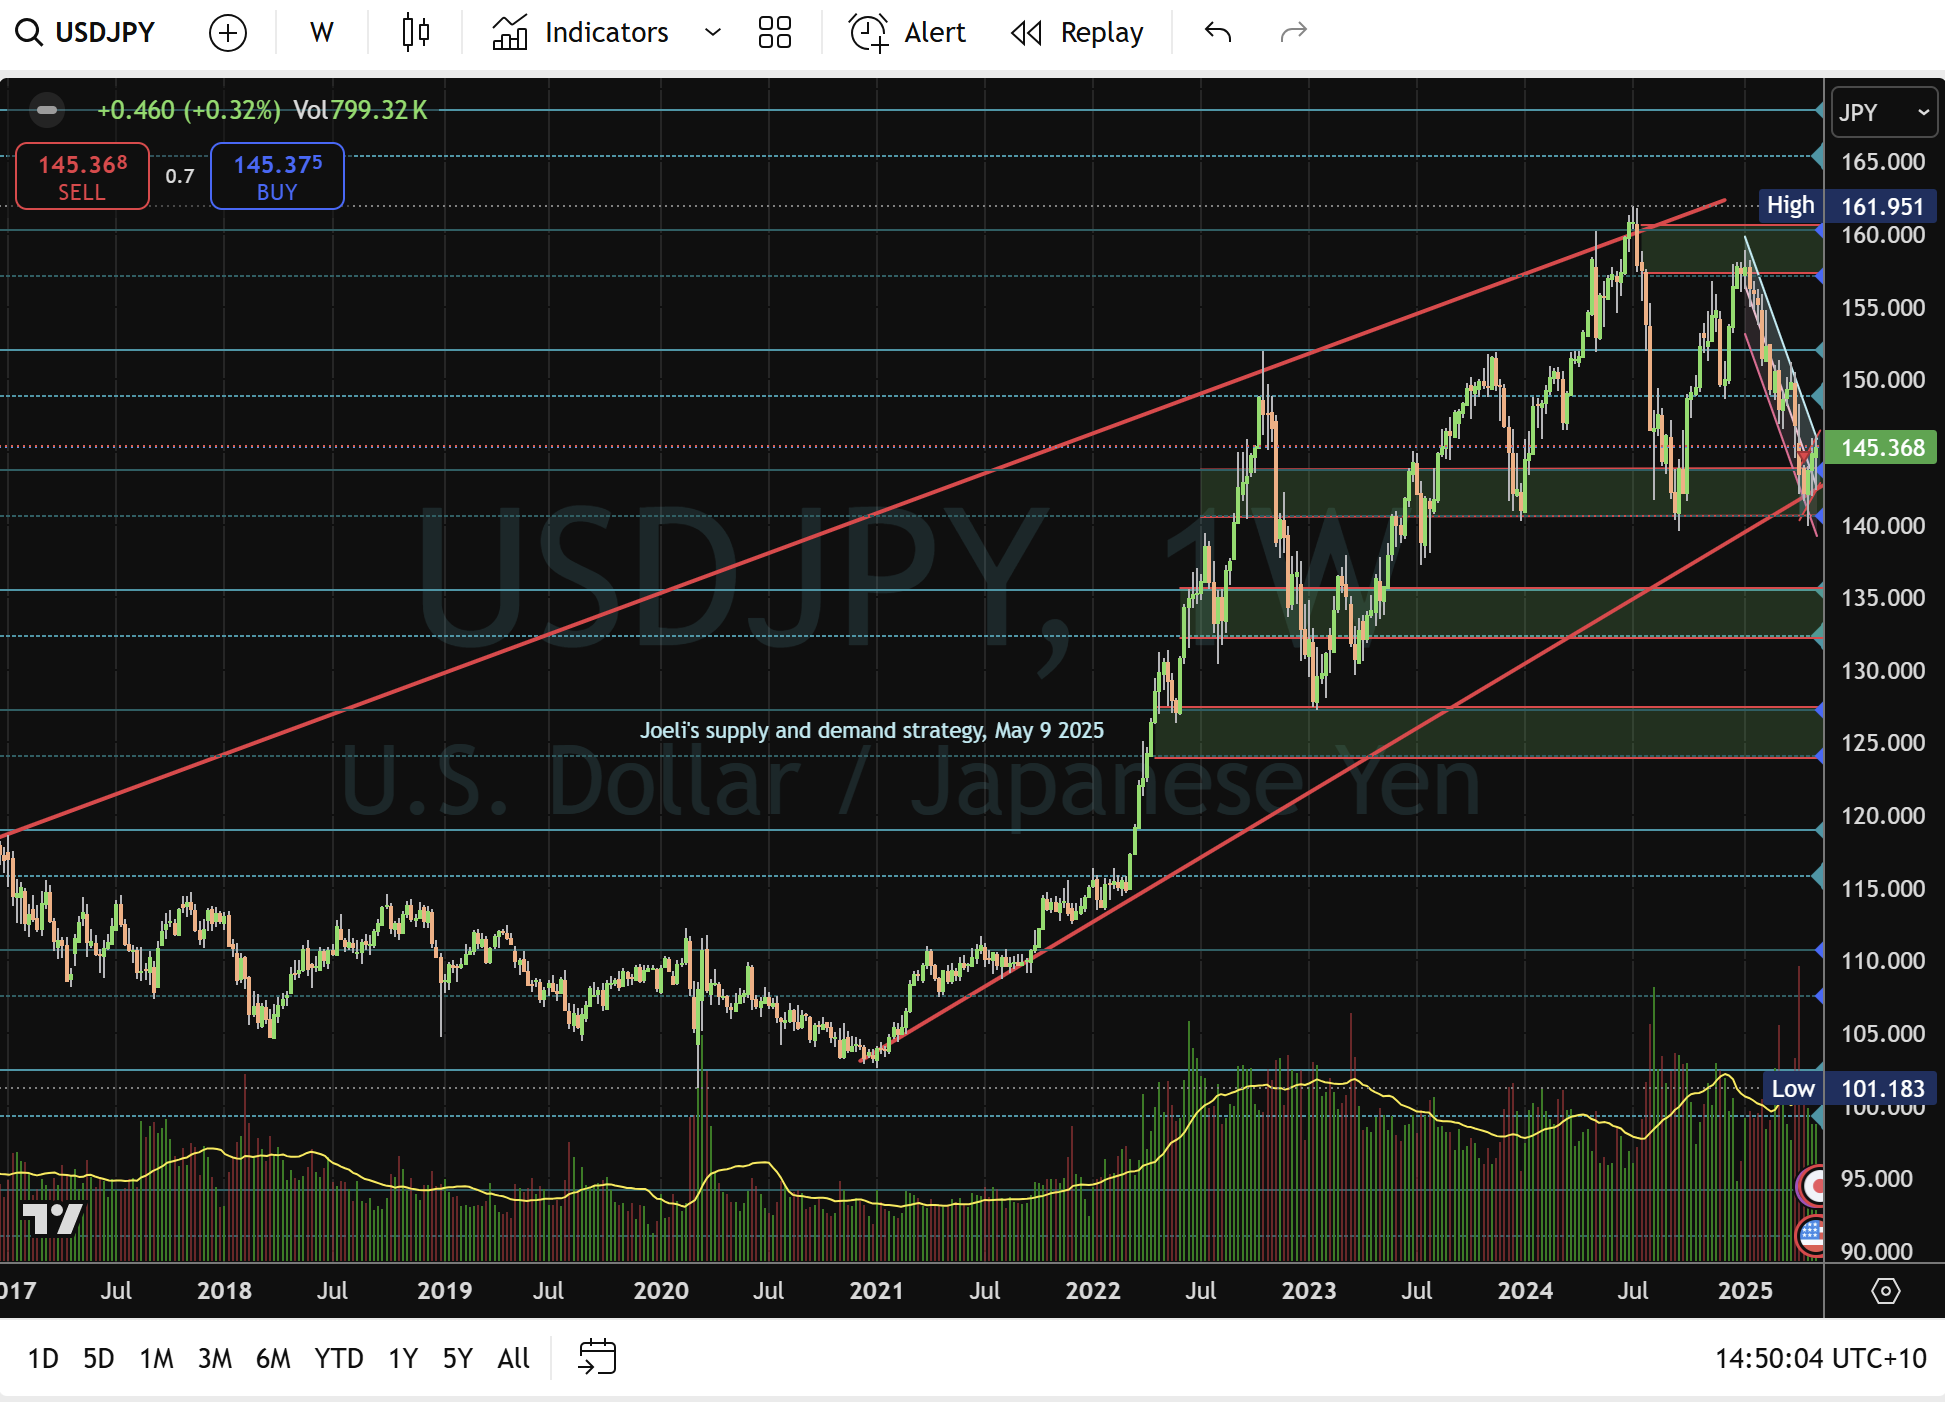
USD/JPY weekly chart
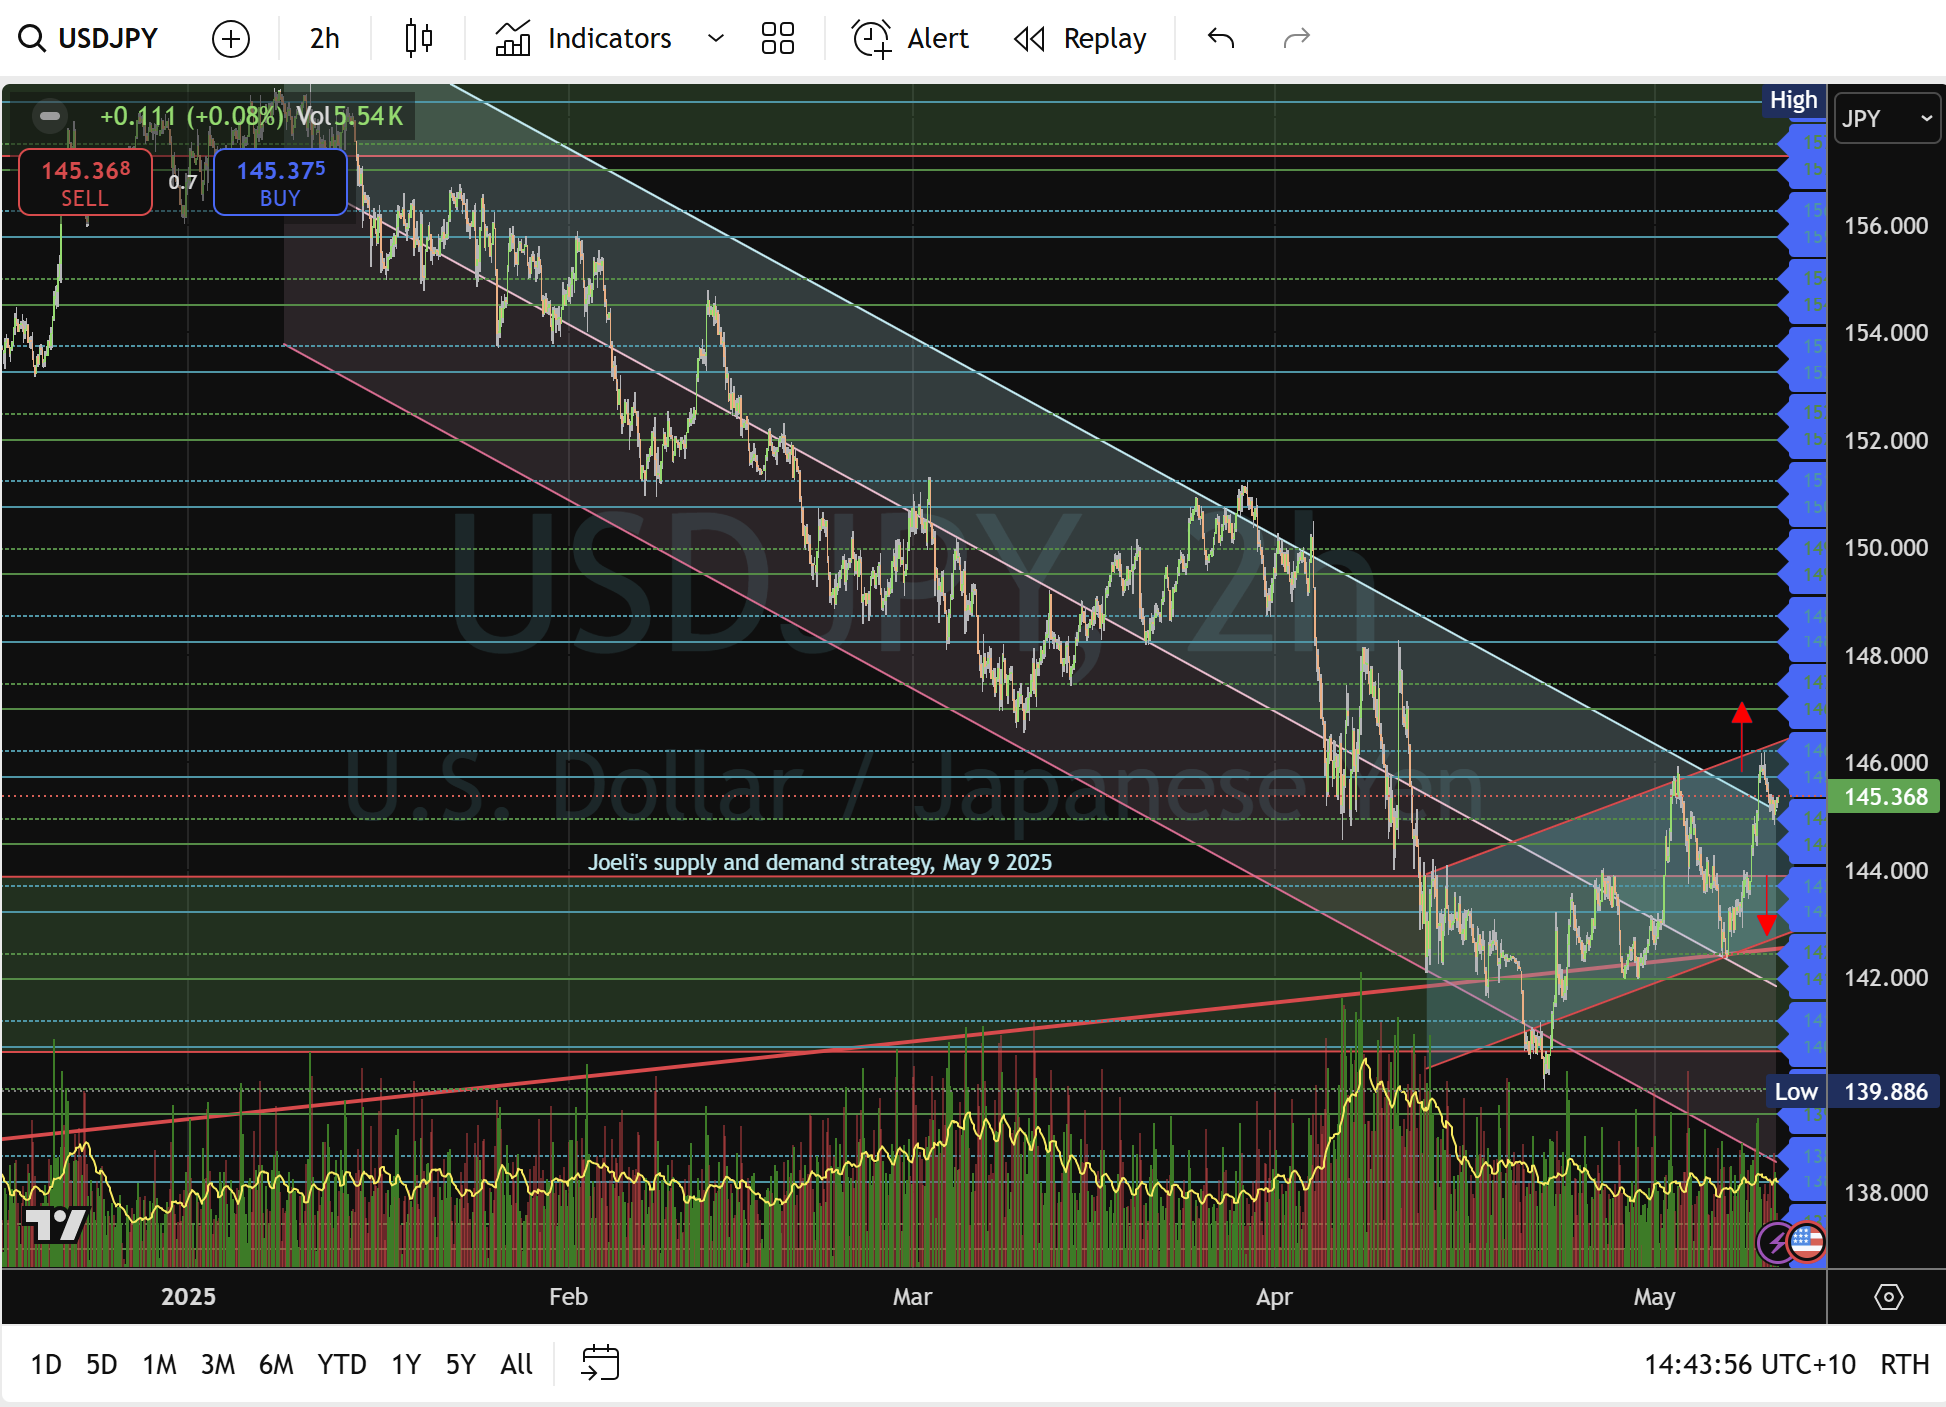
USD/JPY H2 chart
Gold: profit‑taking amid consolidation
Technical setup: After April's explosive move toward 3392, gold pulled back into the 3338–3292 zone. The H4 volume profile shows a Point of Control near 3330, marking it as a key battleground. Bollinger Bands on H4 are tightening after an expansion, suggesting volatility contraction ahead. A break above the upper band at 3340 could spark a fresh rally, while a drop below the lower band at 3292 may lead to accelerated selling. The daily RSI sits neutral at 50, so momentum confirmation is needed before committing to directional trades. Price has cleared the 20-period SMA on H4, but remains below the 50-period SMA, indicating short-term strength but medium-term indecision.
Fundamental drivers:
- Real yield pressure: U.S. real yields rising above 1.2% reduce gold's non‑yielded appeal.
- Inflation hedge: Elevated global inflation keeps gold bids alive, especially amid central bank gold-buying (e.g., India, China).
- Dollar correlation: Gold remains inversely tied to DXY surges-strength in DXY will cap gold.
Key levels:
- Bearish break: Close below 3292 → targets 3223, 3200, then 3113, 3044.
- Bullish pivot: Hold above 3338 → retest 3392, then 3460.
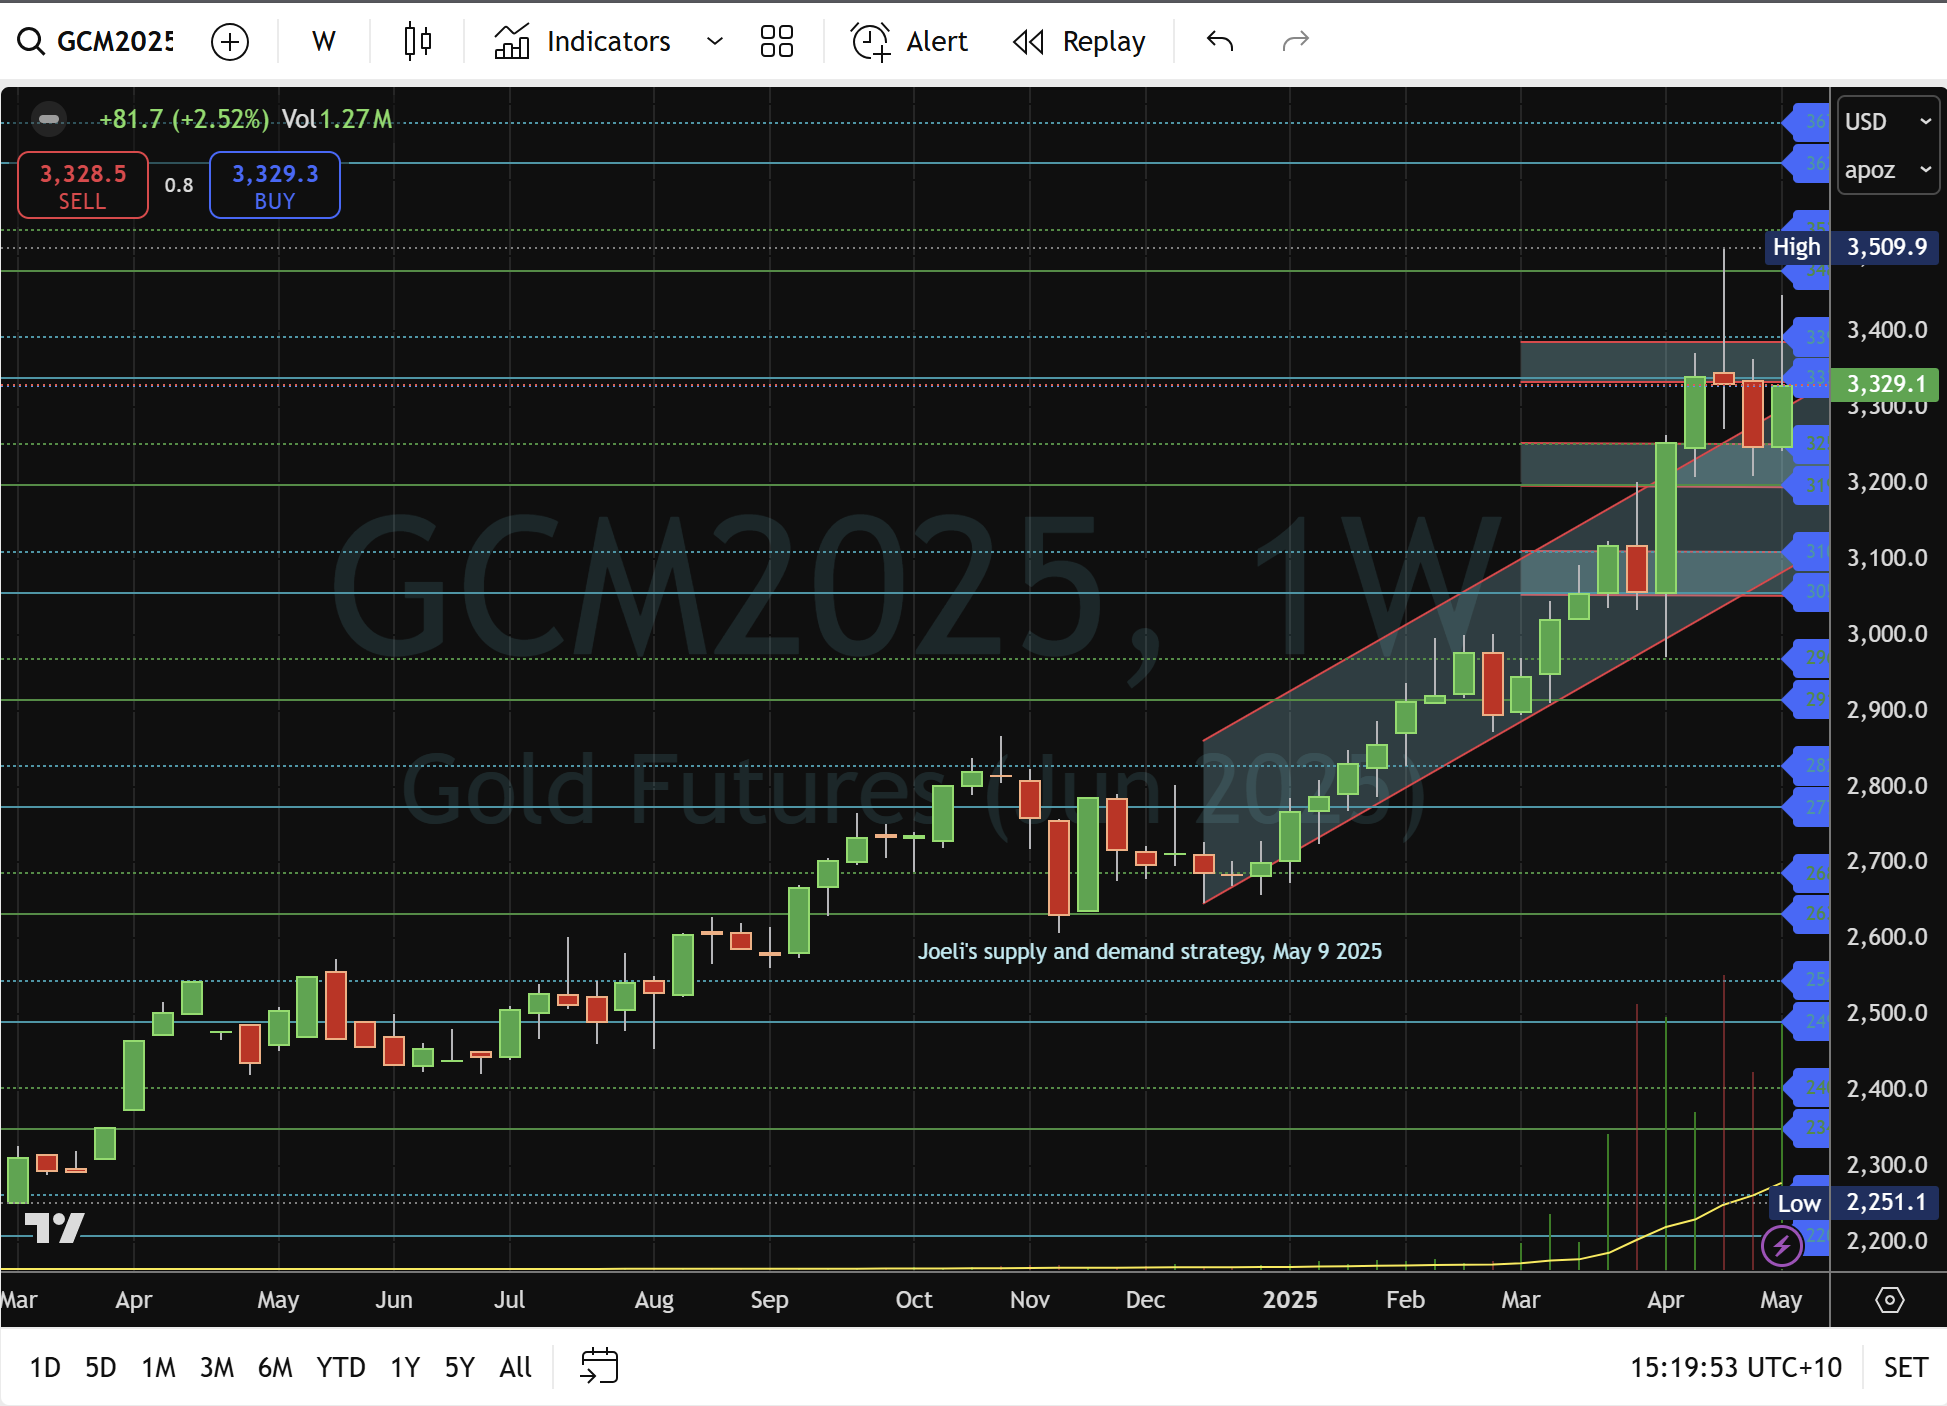
Gold weekly chart
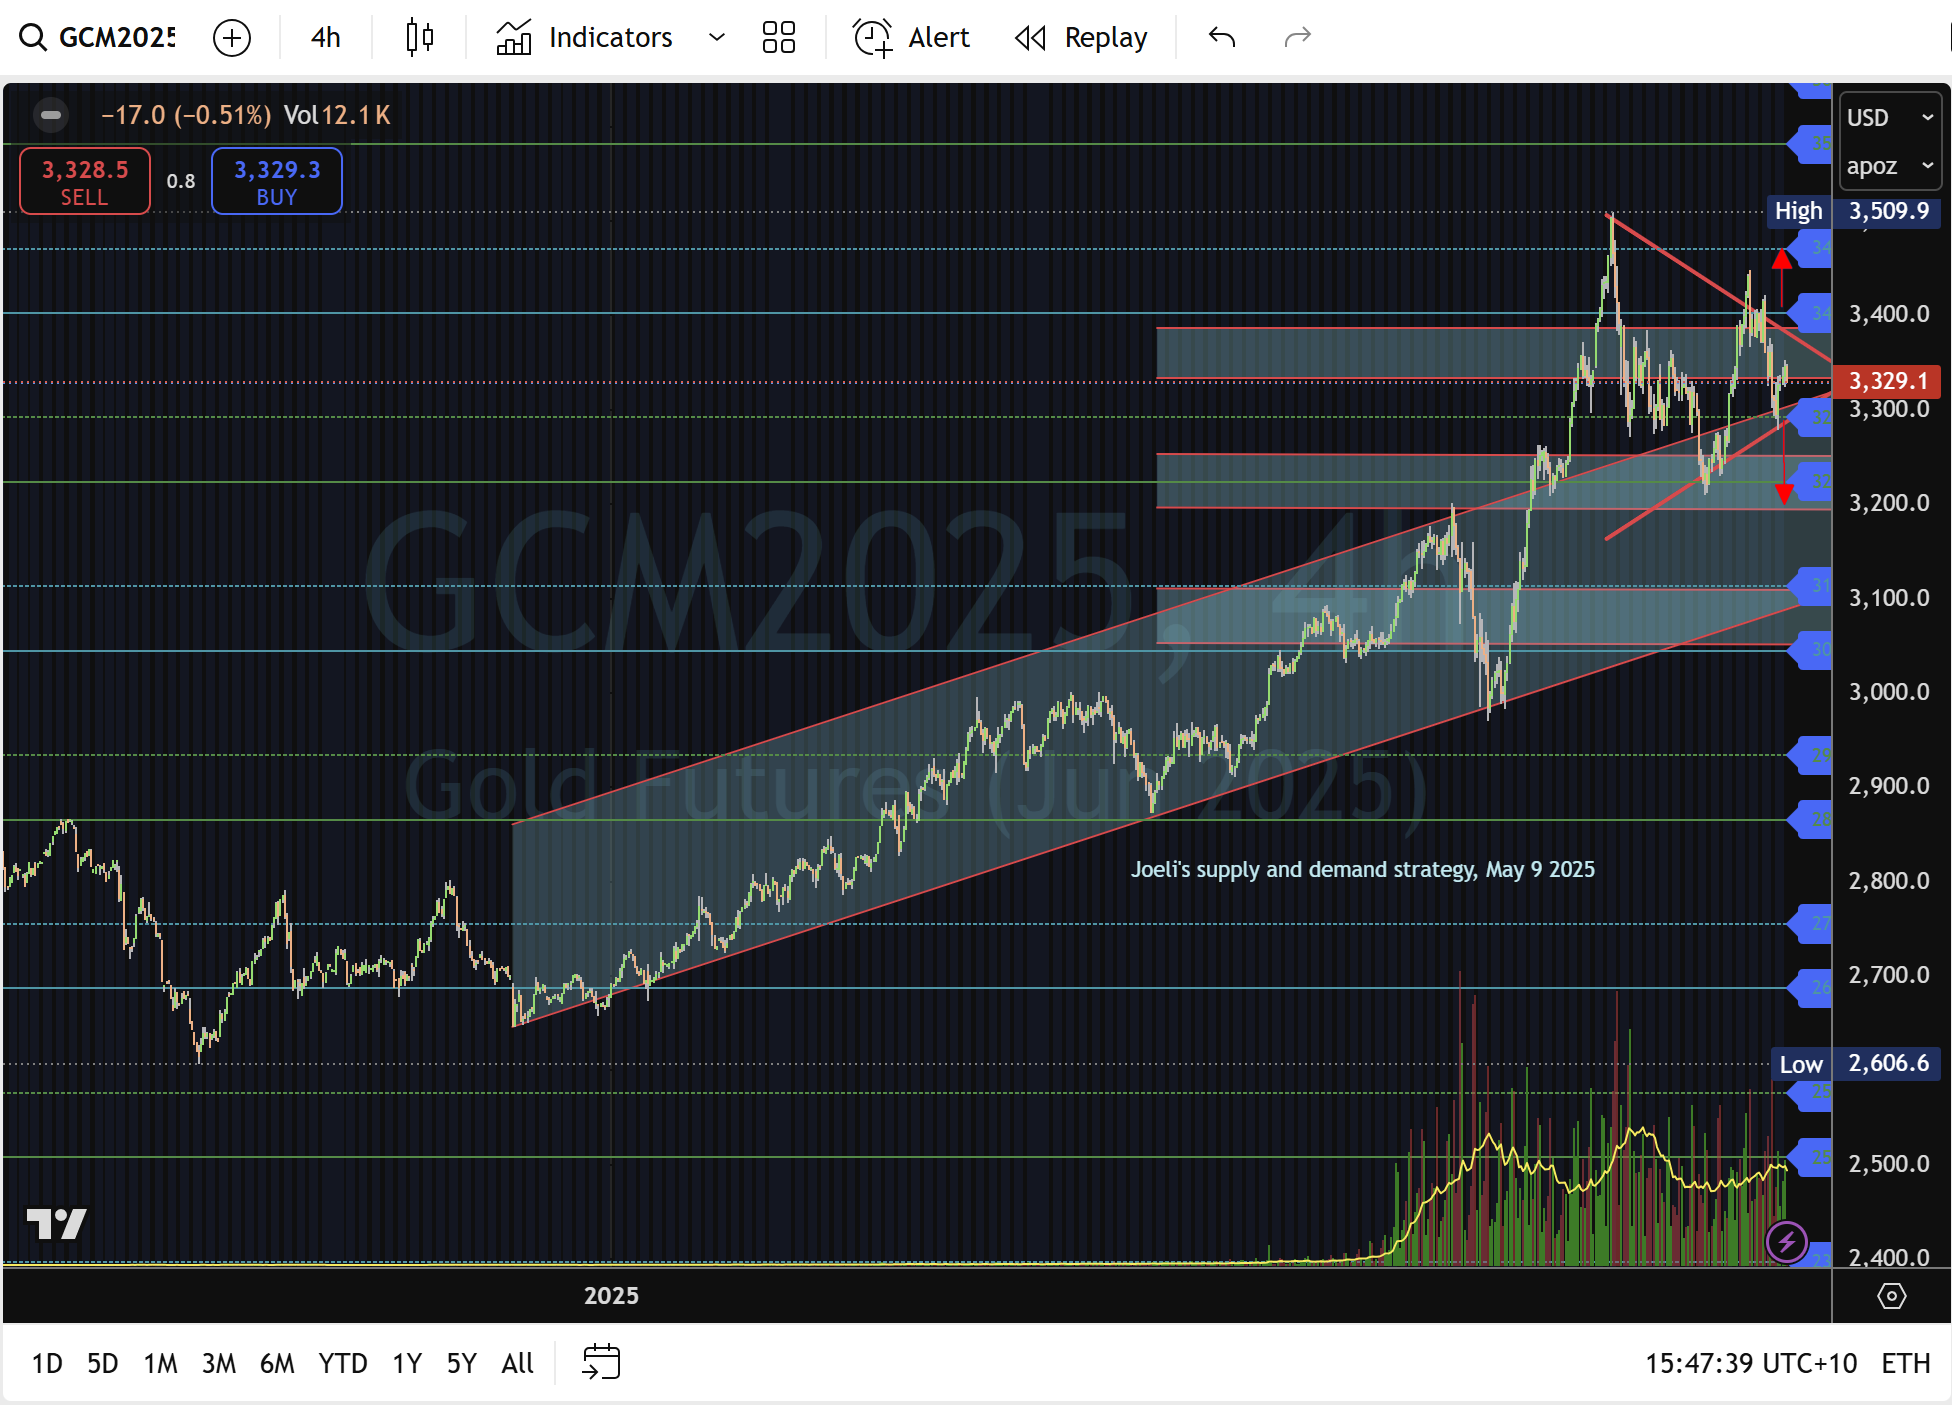
Gold H4 chart
Conclusion
A decisive breach of DXY's 100.81 level would validate a trend reversal, prompting cross‑asset shifts, weakening EUR/USD and gold, and renewed USD/JPY rallies unless BoJ intervenes-conversely, failure to sustain above 99-90 risks a return to three‑month lows. Traders should watch tariff headlines, central bank communications, and U.S. yield curve moves to confirm or negate these technical setups.
Author

Denis Joeli Fatiaki
Independent Analyst
Denis Joeli Fatiaki possesses over a decade of extensive experience as a multi-asset trader and Market Strategist.


