Dollar tracking yields nudges EUR/USD to support
EUR/USD:
Weekly timeframe:
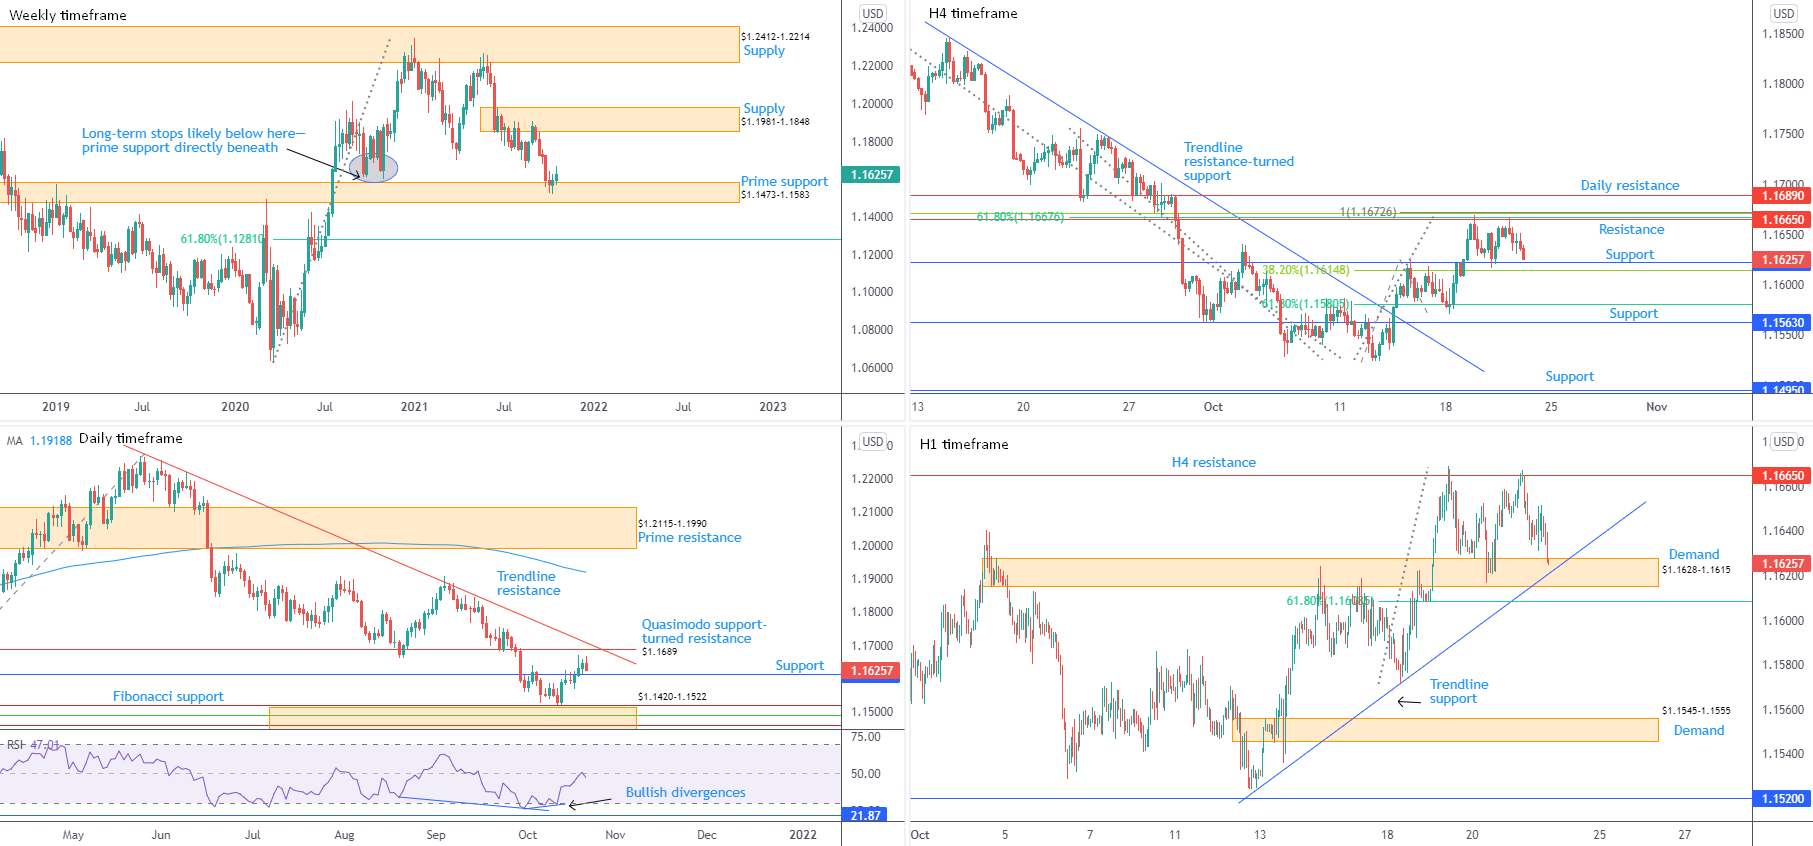
Prime support at $1.1473-1.1583 remains a focal point on the weekly scale, an area inviting a bullish phase so far this week. Possibly fuelled on the back of long-term sell-stops tripped beneath lows at $1.1612 (2020), $1.1981-1.1848 supply is recognised as the next upside objective on this scale.
In the event buyers fail to agree higher prices, south of current support shines the technical spotlight on a 61.8% Fibonacci retracement at $1.1281.
Daily timeframe:
Recent developments reveal the unit climbed $1.1614 resistance earlier in the week, which subsequently delivered support. Quasimodo support-turned resistance at $1.1689 remains in the spotlight, sharing chart space with trendline resistance, taken from the high $1.2254.
The relative strength index (RSI) voyaged into the 50.00 centreline in recent trading. Overthrowing this line informs traders that average gains exceed average losses and momentum is to the upside, while 50.00 offering resistance suggests bears could put in another appearance.
In terms of trend, sentiment has favoured downside since June.
H4 timeframe:
Resistance at $1.1665, along with a tight Fibonacci cluster set just above, maintained position since the beginning of this week. Equally interesting is support from $1.1622, arranged a touch above a 38.2% Fibonacci retracement at $1.1615, has also managed to withstand a bearish attempt. Should the latter welcome buyers for a second time, technically speaking, we might be dealing with a consolidation.
Beneath the said support, a 61.8% Fibonacci retracement at $1.1581 is on the radar, followed by another support coming in from $1.1563.
H1 timeframe:
Reinforcing H4 support between $1.1615 and $1.1622 is a supply-turned demand from $1.1628-1.1615 on the H1 scale, together with trendline support, taken from the low $1.1525.
Fibonacci enthusiasts will also note a 61.8% Fibonacci retracement at $1.1609 is present a touch beneath the said support structure.
Observed Technical Levels:
The combination of daily support at $1.1614, H4 support between $1.1615 and $1.1622, and H1 supply-turned demand from $1.1628-1.1615 (and trendline support), provides a reasonably meaty floor of support to work with. On top of this, buyers recently came in from the weekly timeframe’s prime support at $1.1473-1.1583.
AUD/USD:
Weekly timeframe:
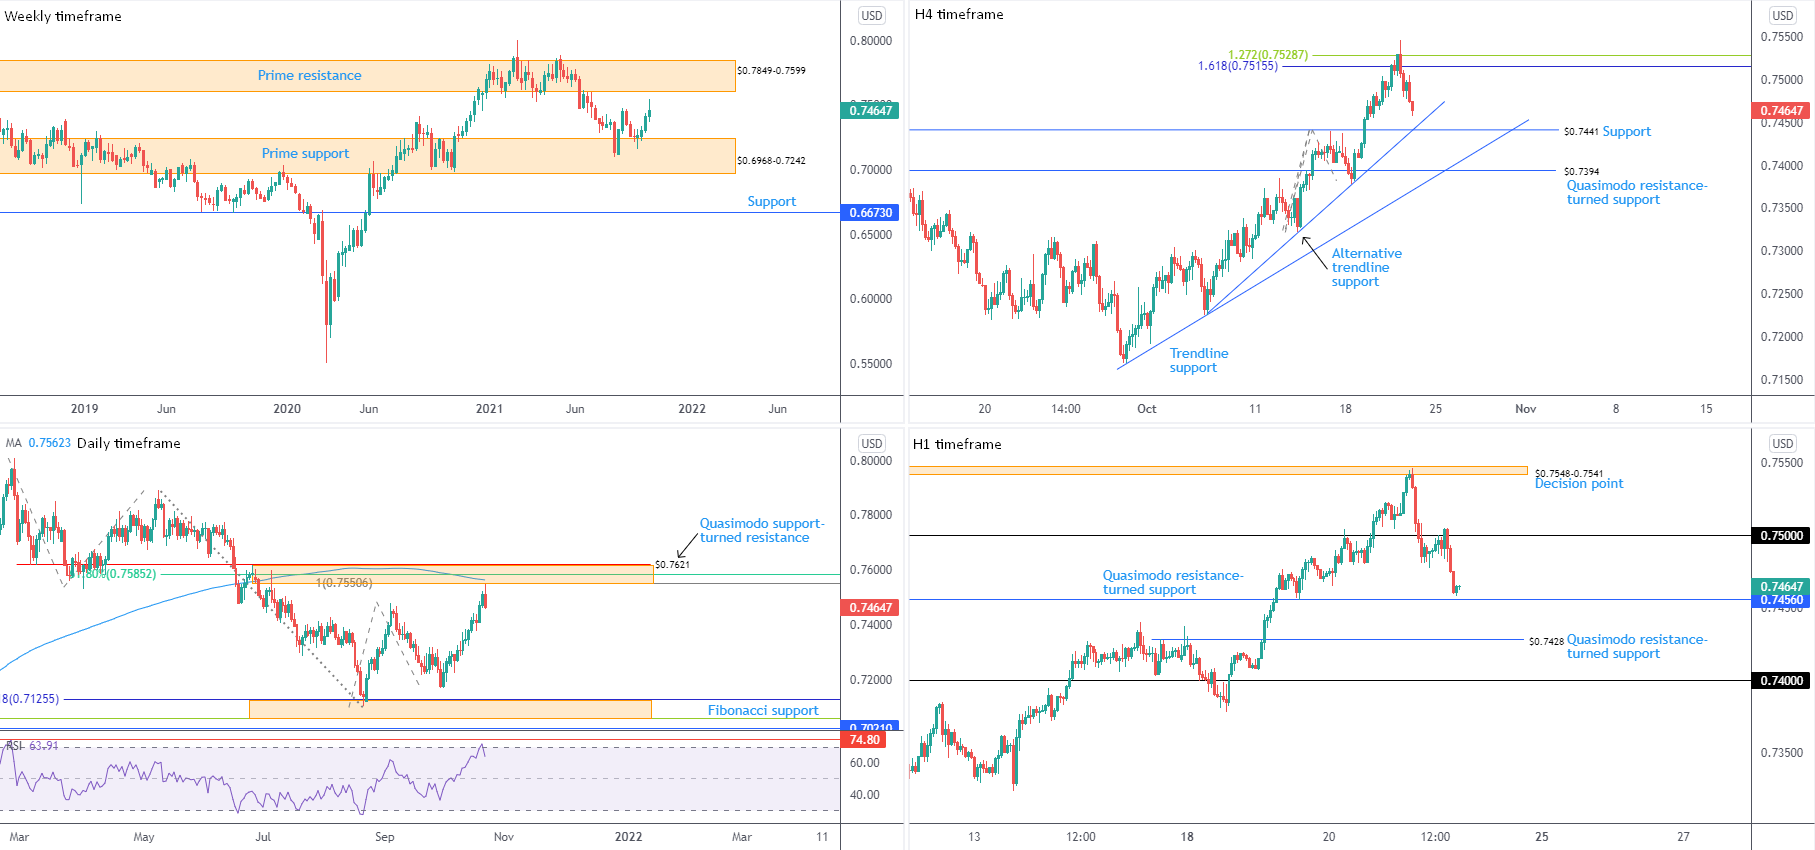
Leaving prime resistance at $0.7849-0.7599 unchallenged, AUD/USD is considerably off session tops, movement throwing light on a possible retest of prime support from $0.6968-0.7242.
Trend studies on the weekly scale show we’ve been higher since early 2020. Consequently, the response from $0.6968-0.7242 might still be the start of a dip-buying attempt to join the current trend.
Daily timeframe:
Joined by the relative strength index (RSI) painting an overbought signal, Thursday came within a handful of pips of shaking hands with resistance between $0.7621 and $0.7551, and formed a bearish outside reversal (comprised of Quasimodo support-turned resistance at $0.7621, the 200-day simple moving average at $0.7562, as well as a 61.8% Fibonacci retracement at $0.7585 and a 100% Fibonacci projection at $0.7551).
Interestingly, the noted resistance between $0.7621 and $0.7551 is fastened to the lower boundary of weekly prime resistance mentioned above at $0.7849-0.7599.
H4 timeframe:
The 1.272% Fibonacci projection at $0.7529 and 1.618% Fibonacci projection from $0.7516 did a superb job holding back buyers Thursday. Formed by way of a bearish outside reversal on the H4 scale, sellers strengthened their grip and dived to within touching distance of an alternative trendline support, drawn from the low $0.7226, and neighbouring support coming in at $0.7441.
Space beneath current supports shines light on additional trendline support, extended from the low $0.7170, and Quasimodo resistance-turned support from $0.7394.
H1 timeframe:
Rising US Treasury yields—benchmark 10-year note rallied to a high of 1.683%—alongside a healthy USD bid, pressured the Australian dollar lower against its US counterpart Thursday and snapped a two-day bullish phase.
Technically, the candles retested the lower side of $0.75 heading into US hours and is within reach of Quasimodo resistance-turned support from $0.7456. This follows Asia driving lower from a tight decision point at $0.7548-0.7541, highlighted in previous analysis.
Beyond $0.7456, another Quasimodo resistance-turned support can be seen from $0.7428, fixed just beneath H4 support at $0.7441, and then $0.74 is in sight.
Observed Technical Levels:
Between $0.7441 support on the H4 and $0.7456 on the H1, this could be an area welcomed if tested. However, understanding daily price pencilled in a top just ahead of resistance at $0.7621-0.7551, upside attempts may struggle.
As such, traders are likely to watch $0.7441-0.7456 closely. Bullish confirmation could bring about a long opportunity, while a H1 close south of the area suggests a bearish theme to $0.74 on the H1, plotted nearby H4 support at $0.7394.
USD/JPY:
Weekly timeframe:
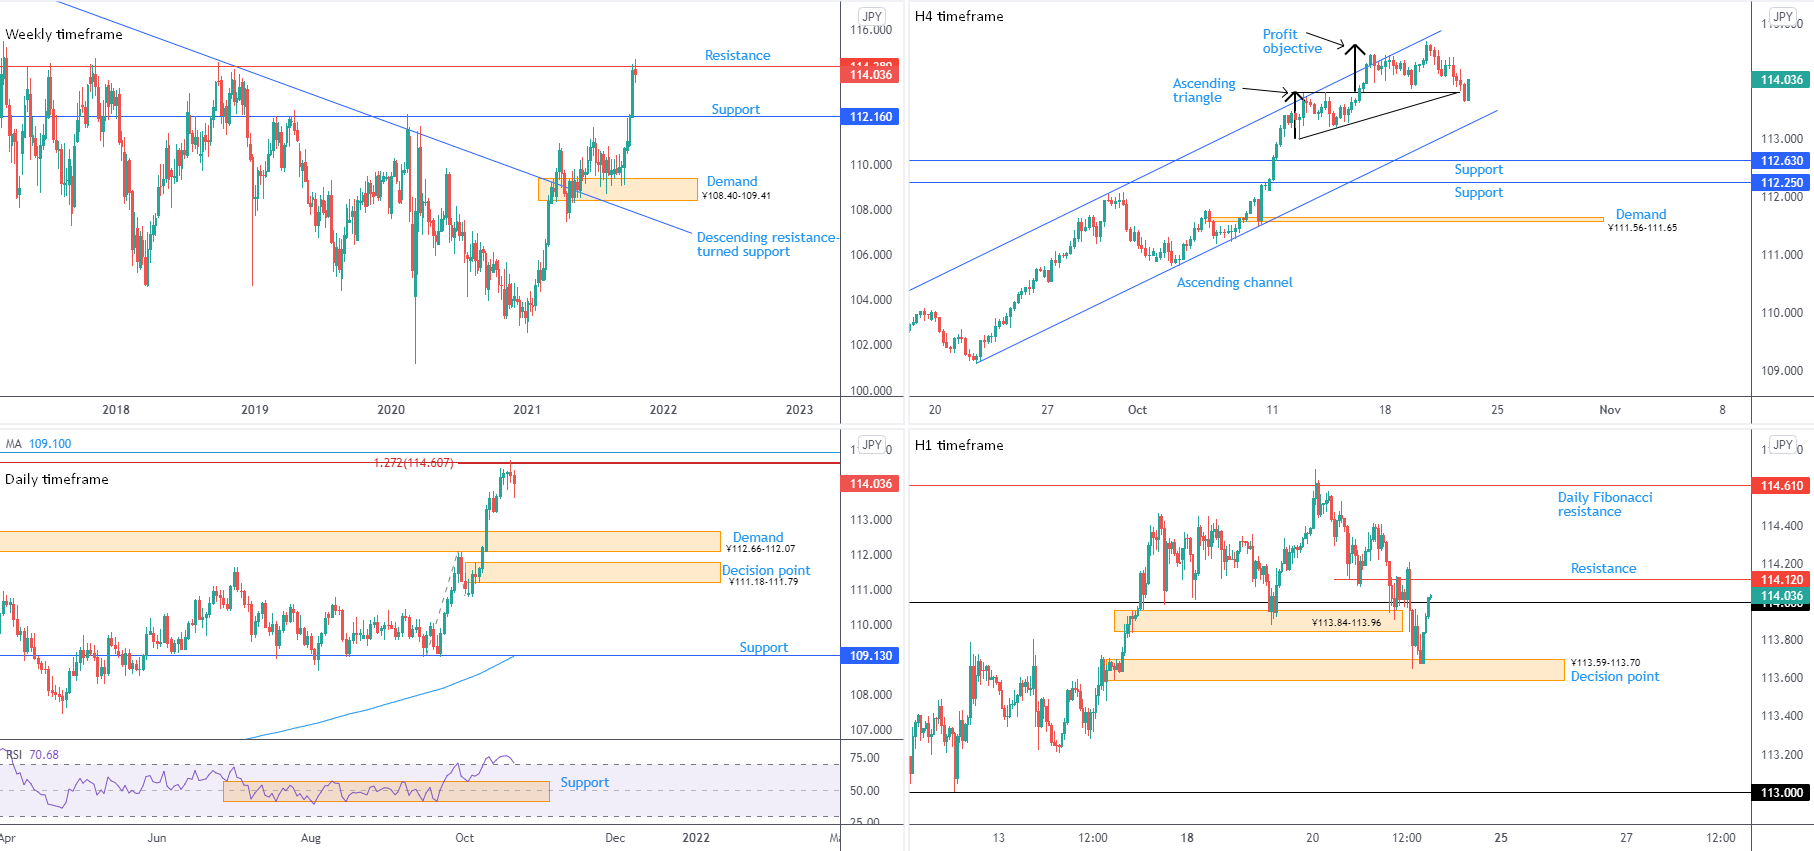
Nestled at the underside of resistance from ¥114.38, USD/JPY registered its sixth consecutive bullish close last week and touched a fresh three-year peak of ¥114.70 in recent trading.
Although current price threatens to form fresh highs, a decisive reaction from resistance sets the stage for bringing in support at ¥112.16.
In terms of trend, we’ve been advancing since the beginning of this year.
Daily timeframe:
The Fibonacci cluster, made up of two 1.272% Fibonacci projections at ¥114.63 and ¥114.61, set a handful of pips beneath a deep 78.6% Fibonacci retracement at ¥114.94, continues to command attention on the daily timeframe. Price touched a low of ¥113.65 amidst Thursday’s movement, with subsequent follow-through action pointing to supply-turned demand at ¥112.66-112.07.
The noted area, along with weekly resistance highlighted above at ¥114.38, is a potential headwind for the currency pair.
From the relative strength index (RSI), following support emerging from 56.85 (prior range resistance), the indicator’s value continues exploring overbought space. However, with the trend facing northbound this year, overbought signals should be viewed in this context.
H4 timeframe:
Recent sessions witnessed the ascending triangle’s (low: ¥113 high: ¥113.79) profit objective (thick black arrows) enter play at ¥114.64, a stone’s throw from familiar channel resistance, taken from the high ¥112.05.
As anticipated, Thursday tunnelled lower and retested the upper side of the ascending triangle. Additional selling directs light towards channel support, pencilled in from the low ¥109.12, and two support levels at ¥112.25 and ¥112.63.
H1 timeframe:
The ¥113.84-113.96 decision point stepped aside going into US trading on Thursday, drawing candle action to a neighbouring decision point at ¥113.59-113.70. The stronger-than-expected recovery from the area lifted price marginally above ¥114 and within range of resistance at ¥114.12. Note this level initially served as a Quasimodo support-turned resistance, and subsequently flipped to a Quasimodo resistance barrier.
Observed Technical Levels:
Weekly resistance at ¥114.38, together with the daily timeframe’s Fibonacci cluster between ¥114.94 and ¥114.61, delivers notable resistance and has (so far) slowed buying.
In light of the above, a retracement could be in the offing. And with that, H4 support derived from the upper side of the ascending triangle at ¥113.81 may struggle to attract bullish interest, consequently placing H1 resistance from ¥114.12 in range as an area sellers could be drawn to.
GBP/USD:
Weekly timeframe:
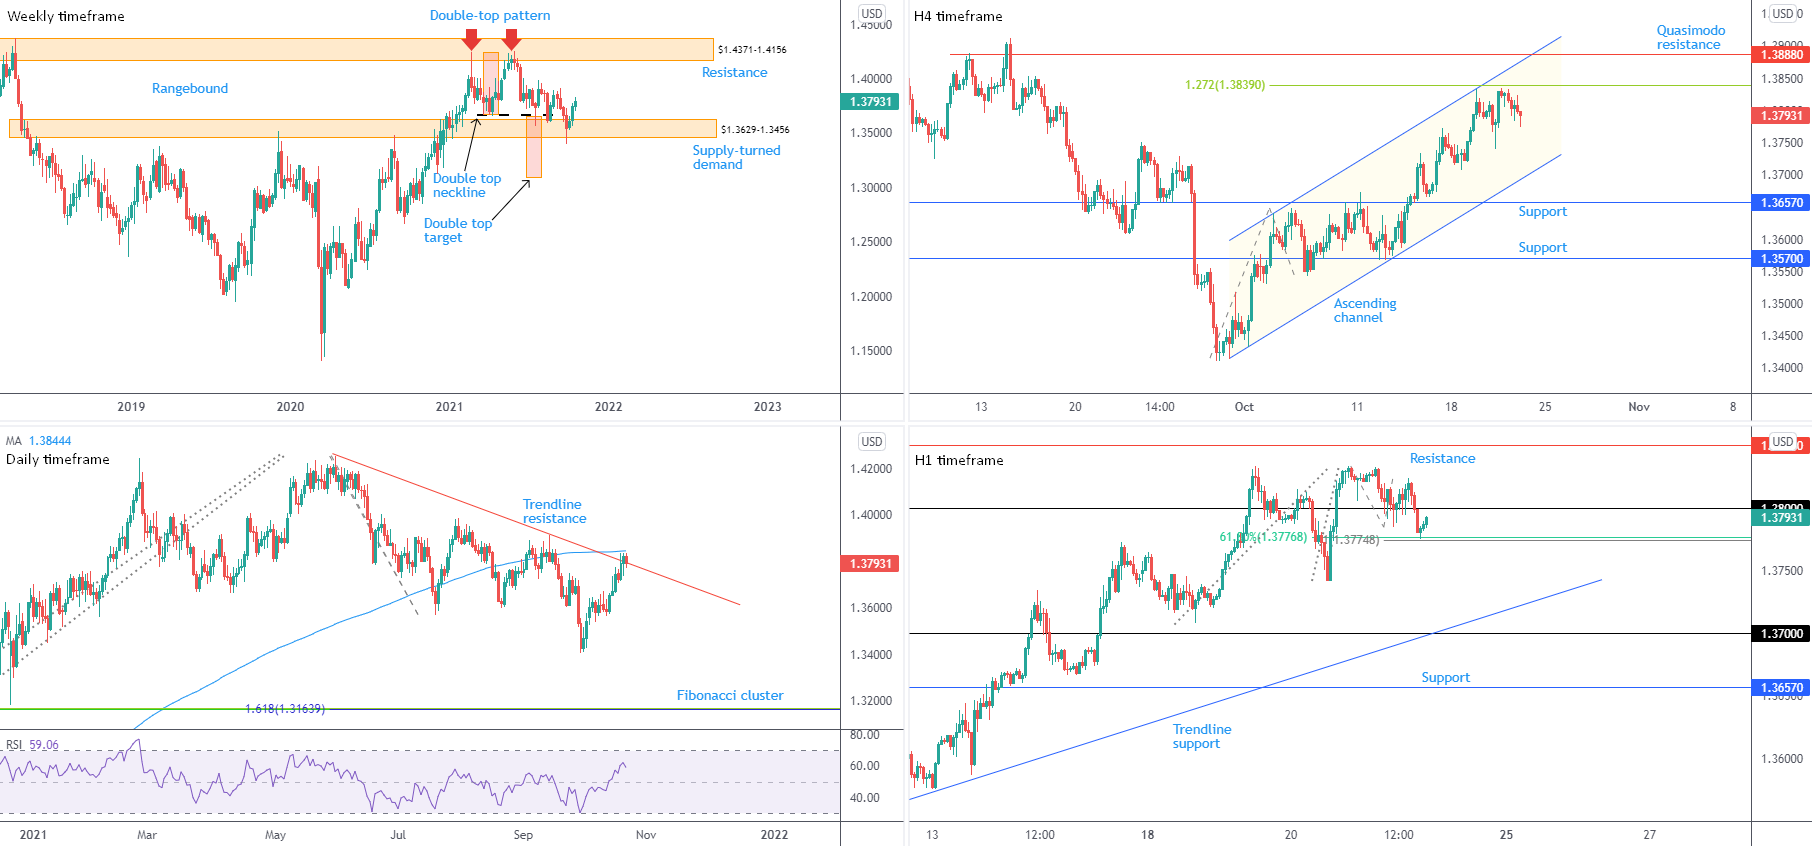
Despite dipping a toe south of supply-turned demand at $1.3629-1.3456 in late September, and closing under a double-top pattern’s ($1.4241) neckline at $1.3669, GBP/USD bulls have been healthy in October, up 2.4 percent MTD.
Should sellers regain consciousness, the double-top pattern’s profit objective—measured by taking the distance between the highest peak to the neckline and extending this value lower from the breakout point—sits around $1.3093.
Daily timeframe:
Wednesday inched above trendline resistance, a descending line taken from the high $1.4250, and came within close proximity of the 200-day simple moving average at $1.3845. Thursday ended modestly lower as USD bulls took control, though whether this is sufficient to save the current trendline resistance is difficult to estimate.
The relative strength index (RSI) secured position above the 50.00 centreline last week, with the indicator currently eyeballing overbought space.
H4 timeframe:
The 1.272% Fibonacci extension at $1.3839 remains active.
North of here, Quasimodo resistance is seen at $1.3888, sharing chart space with channel resistance, drawn from the high $1.3640.
To the downside, technicians are likely watching channel support, taken from the low $1.3415.
H1 timeframe:
Short-term movement on the H1 scale led candles beneath $1.38 on Thursday, touching a low of $1.3776 and kissing a tight Fibonacci cluster around $1.3777.
Below, Wednesday’s trough calls for attention at $1.3742, closely shadowed by $1.37 and trendline support, extended from the low $1.3433. While traveling above $1.38 points to resistance from $1.3851.
Observed Technical Levels:
The daily timeframe echoes an indecisive tone around trendline resistance, taken from the high $1.4250, and this, as highlighted in previous writing, is likely a concern for weekly shorts based on price closing under a double-top pattern’s ($1.4241) neckline at $1.3669.
Should H1 candles hold the underside of $1.38, triggering moves towards $1.37 may be on the menu, which happens to align with the H4 timeframe’s channel support, from the low $1.3415.
Author

Aaron Hill
FP Markets
After completing his Bachelor’s degree in English and Creative Writing in the UK, and subsequently spending a handful of years teaching English as a foreign language teacher around Asia, Aaron was introduced to financial trading,


