Dollar to retest the underside of 50-day SMA?

Weekly review
A lot happened last week.
Despite the recent banking turmoil, three central banks raised their benchmark interest rates last week as they continue to attempt to tackle elevated inflation. In fact, the month of March witnessed five central banks hike rates, including the US Federal Reserve recently increasing its Fed Funds rate by another 25 basis points, a move lifting the Target Range to between 4.75% and 5.00% and marking its ninth consecutive increase since early 2022. Interestingly, with the latest announcement, investors received the Summary of Economic Projections (SEP). The so-called median ‘Dot Plot’ specified that FOMC participants see one more 25 basis-point hike this year and a terminal rate forecast of 5.1%, unchanged from December’s projections.
The S&P Global PMIs for March gripped the markets on Friday; services across developed economies were upbeat, while manufacturing received a blow and remains in contractionary territory. A notable decline in manufacturing was evident in Germany, tumbling to 44.4 (vs expected 47.1), its lowest value since 2020. Europe’s shared currency consequently underperformed against its G10 peers on Friday, with EUR/USD and EUR/JPY down 0.7%.
Also in the spotlight, fresh concerns arose in the banking sector last week. Following the decline of Credit Suisse and the state-backed UBS rescue, Deutsche Bank stole the limelight in the second half of the week, shedding 8.5% on Friday, its largest one-day decline since June 2022. At one point, shares were down an eye-watering 14.0%. According to research, the catalyst behind the fall was the rise in Credit Default Swaps (CDS)—in place to hedge against the risk of default—in the second half of the week for the bank, an indication that investors are concerned about the health of the organisation.
In other markets, global equity indices finished the week higher. US Treasury yields also bull steepened along with the US Dollar Index printing its second back-to-back weekly decline (-0.7%). According to the S&P 500 sectors, communication services stocks outperformed, gaining 3.3%, with the only two lagging sectors on the week being real estate and utilities, down 1.3% and 1.2%, respectively. Oil prices (WTI) added 4.1% in the commodities space after refreshing lows of $64.35/bbl (its lowest level since November 2021). However, keep in mind that this market remains entrenched in a dominant bear trend, and the recent recovery could simply represent a pullback to eventually pursue deeper waters. Regarding precious metals, spot gold (XAU/USD) echoed a tentative tone, down 0.5%, while spot silver (XAG/USD) extended recovery gains, adding nearly 3.0%. Finally, across the major crypto market, XRP/USD and LTC/USD jumped, rallying 19.0% and 12.0%, respectively, at the time of writing.
Economic Data for the Final Full Week of March:
Monday 27 March
German IFO Survey for March at 9:00 am GMT
Expectations heading into the event largely forecast an unchanged release at 91.0 after February’s 91.1% print.
Tuesday 28 March
US (Conference Board) Consumer Confidence for March at 3:00 pm GMT
As a leading indicator of consumer spending, consumer confidence is expected to decrease to 101.0 in March from February’s 102.9. However, the forecast range resides between 104.0 and 98.5.
Wednesday 29 March
Annual Inflation Rate for Australia for February at 1:30 am GMT
The consensus heading into the event forecasts annual inflation to have increased to 7.6% in the 12 months to February from January’s year-over-year 7.4% reading.
Thursday 30 March
US Initial Jobless Claims for the Week Ending 25 March at 1:30 pm GMT
Following the previous week’s 191,000 reading, expectations forecast an unchanged release of 193,000 unemployment claims. The forecast range, however, is between 210,000 and 190,000.
Friday 31 March
Annual Inflation Rate for the euro area (Flash) for March at 10:00 am GMT
Annual inflation for the euro area eased to 8.5% in February, its fourth consecutive fall since peaking at 10.6% in October. Economists estimate consumer prices will slow to 7.2% in the twelve months to March.
Month-Over-Month US Core PCE Price Index for February at 1:30 pm GMT
As the Fed’s primary measure of inflation, this will be a widely watched event. The median estimate calls for a 0.3% print, slightly lower than January’s 0.6% release.
Technical Markets to Watch for the Week Ahead
Currencies:
Dollar to Retest the Underside of 50-Day SMA?
Versus a basket of six major international currencies, the US dollar finished another week on the ropes (-0.7%) though considerably off worst levels.
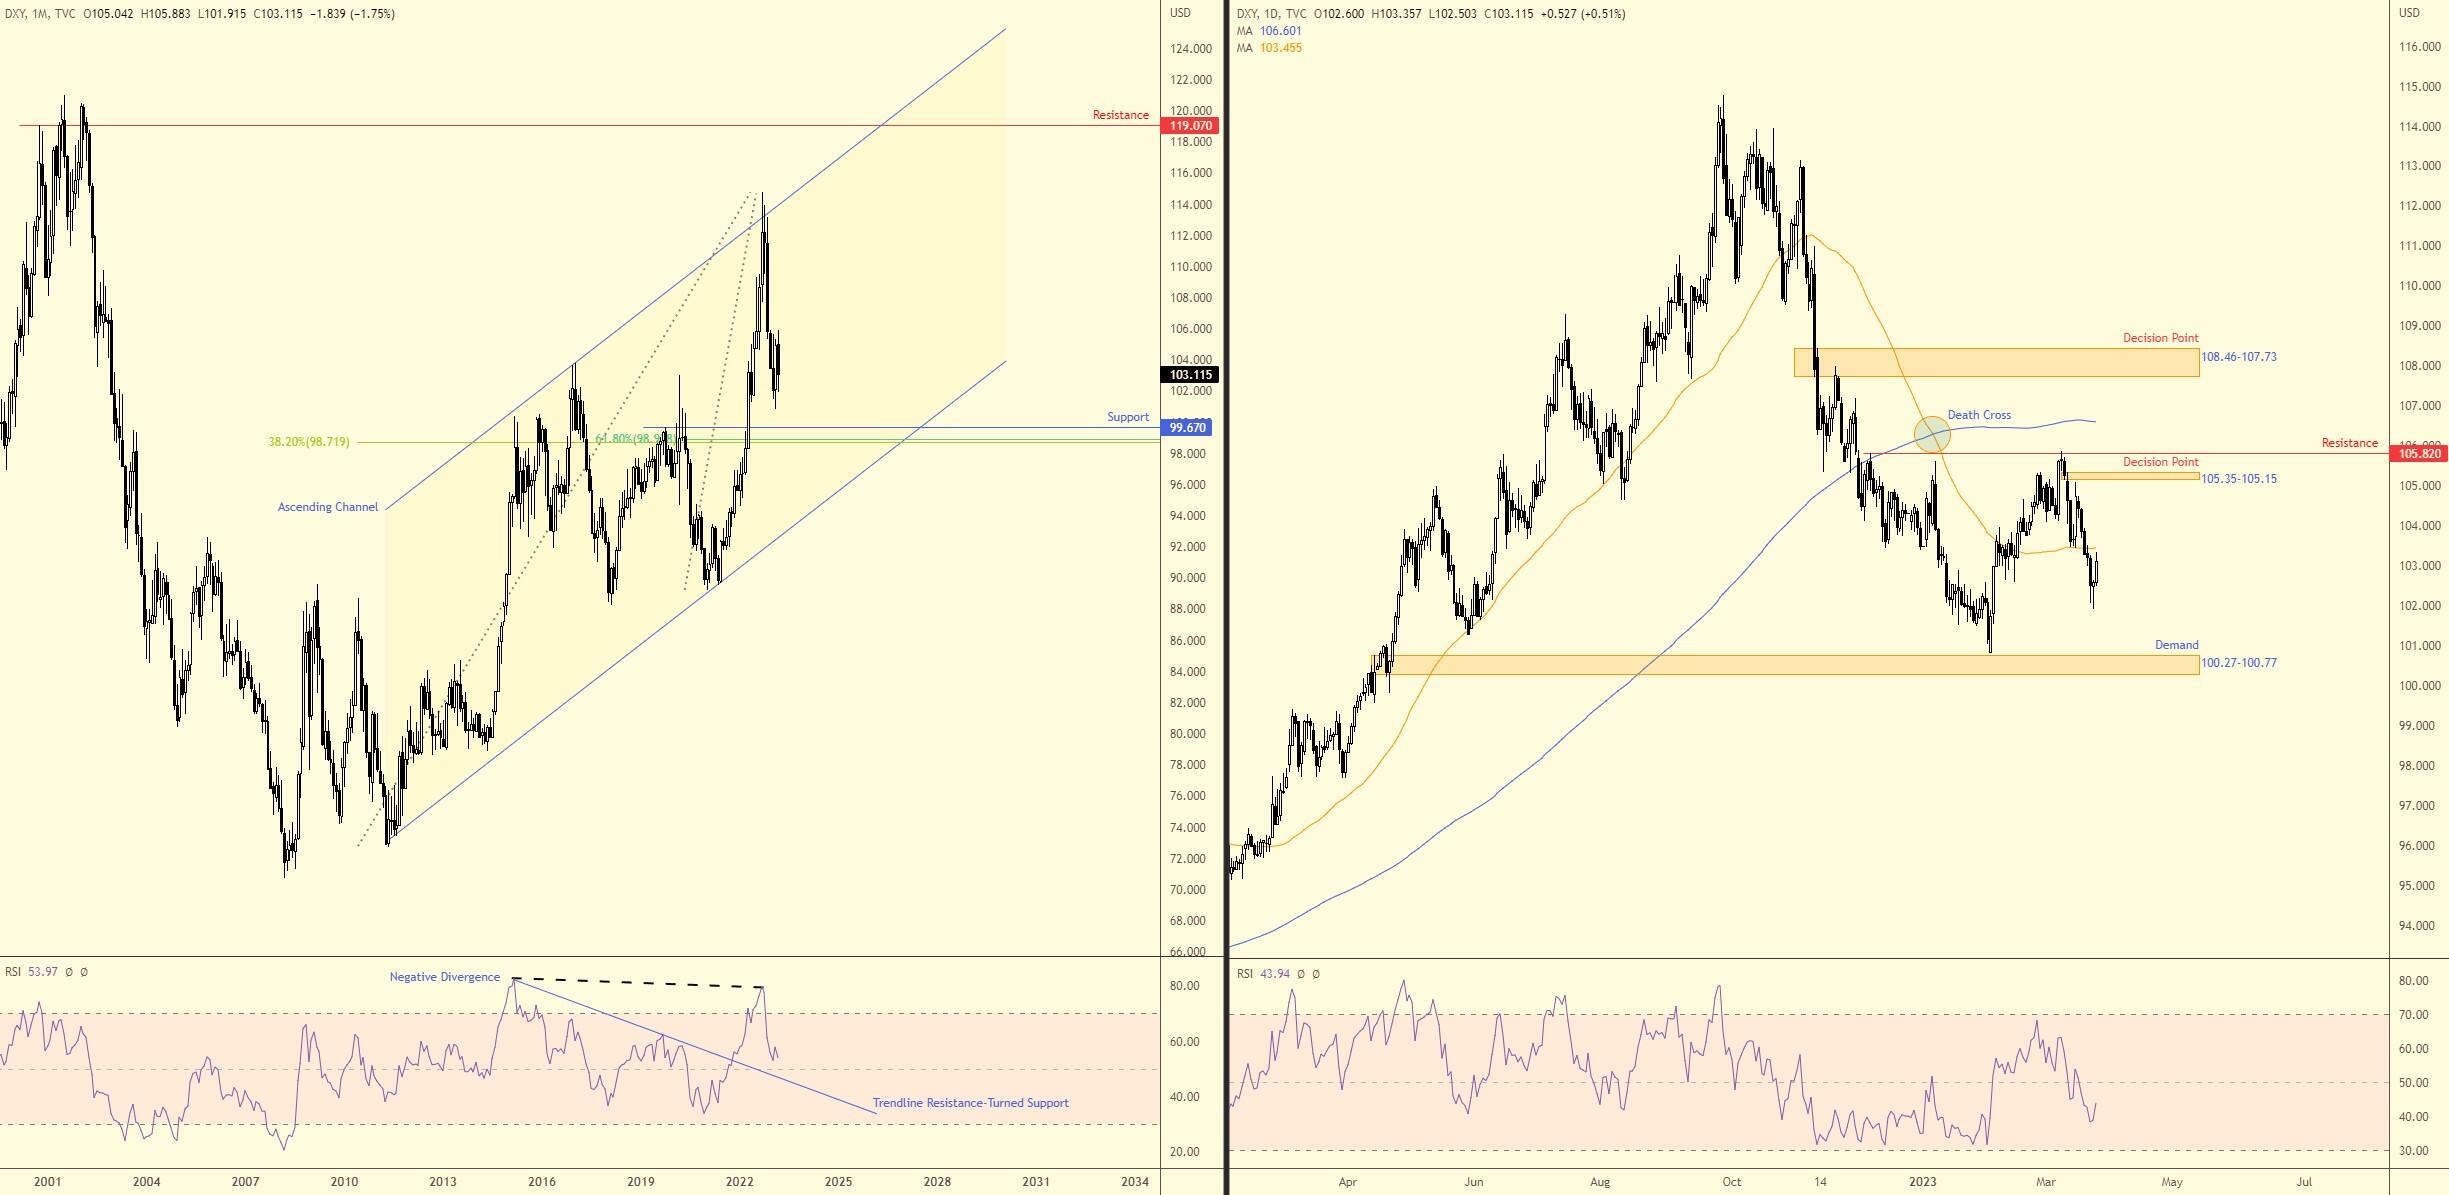
You may recall from the prior week’s Market Insight that I highlighted a bearish scenario could unfold on the US Dollar Index. As you can see on the daily timeframe, the beginning of the week observed a moderate close south of its 50-day simple moving average (103.46), and subsequent bearish flow emerged to touch lows of 101.92 on Thursday. However, the day concluded by way of a hammer candlestick pattern (a Japanese candlestick formation designed to emphasise a bullish signal), which prepared the ground for an advance on Friday. The key observation heading into the final full week of March, therefore (alongside the buck trending south since late 2022), is the underside of the 50-day simple moving average, perhaps establishing dynamic resistance this week, aided by local lows (resistance) of around 103.48. A rejection shifts focus to demand at 100.27-100.77; rupturing the dynamic SMA to the upside, on the other hand, shines the technical spotlight on a thin decision point from 105.35-105.15.
Underpinning the possibility of SMA resistance gracing the daily chart this week is the bigger picture: the monthly timeframe. Q4 of 2022 saw price action on the monthly reject ascending channel resistance taken from the high of 103.82 in a market trending higher since 2008. Technical elements show the dollar remains depressed, and expectations call for further selling towards support from 99.67. In the context of the Relative Strength Index (RSI), the indicator is still on the doorstep of its 50.00 centreline, which happens to be shadowed by an indicator trendline resistance-turned-support pencilled in from the high 82.87.
According to chart studies, further dollar softness is expected over the coming weeks. If tested, the 50-day simple moving average at 103.46 represents prominent resistance on the daily chart and could encourage a sell-on-rally scene, targeting daily demand at 100.27-100.77. However, a daily close above the SMA is not out of the question, movement pulling the daily decision point back into view at 105.35-105.15 as a possible ceiling.
EUR/CHF Recoiling from Long-term Record Low
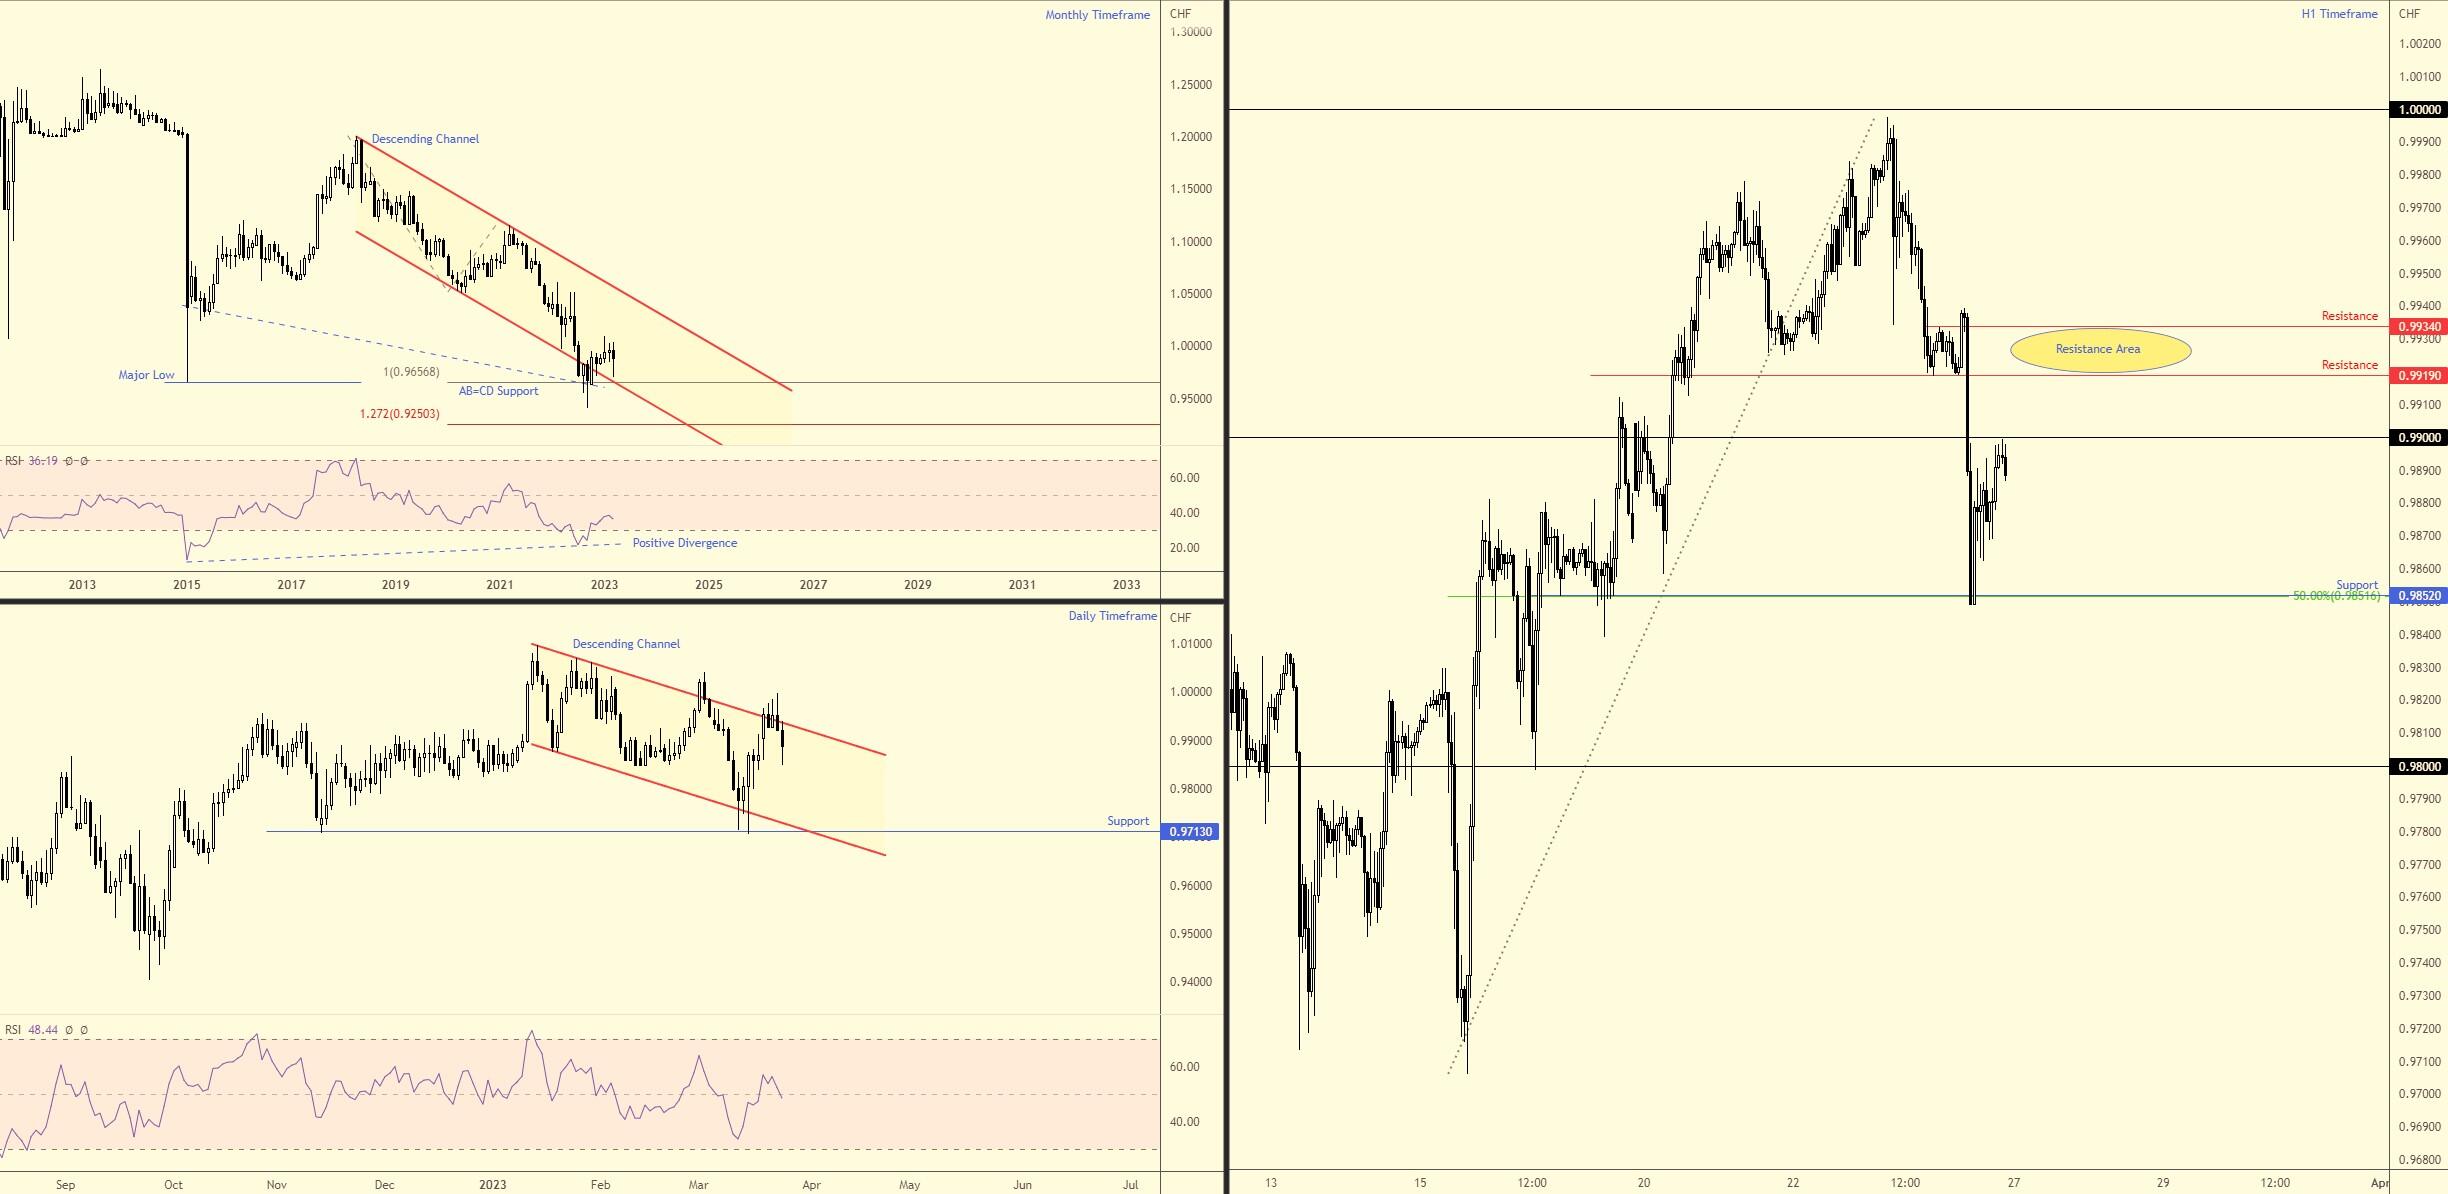
From the monthly timeframe, we can see the currency pair forged fresh record lows in late September at CHF0.9403 and has since modestly recoiled higher. Aiding the rebound is AB=CD Harmonic support, denoted by the 100% projection at CHF0.9657, channel support taken from the low CHF1.0508, and long-term positive divergence from the Relative Strength Index (RSI). Regarding trend, this market’s long-term direction is clearly south.
A closer look at price action on the daily timeframe shows the unit testing the limits of a channel resistance etched from the high CHF1.0097. This follows a rebound from support at CHF0.9713 (and channel support from the low CHF0.9875). If we manage to find acceptance north of the aforementioned channel resistance this week, as suggested by the RSI retesting the 50.00 centreline as possible support, limited (obvious) resistance is visible on the daily chart.
As evident from the H1 timeframe, Friday posted a rebound from support at CHF0.9852, a level sharing chart space with a 50.0% retracement. Overhead, CHF0.99 is close by, while pushing higher provides a basis to approach resistance between CHF0.9934 and CHF0.9919. Given the monthly chart displaying little sign of wanting to pullback further and the daily chart testing the lower side of channel resistance, a whipsaw north of CHF0.99 (some may refer to this as a ‘stop run’) could emerge to welcome sellers from H1 resistance between CHF0.9934 and CHF0.9919 this week.
Charts: TradingView
Commodities:
Gold Eyes $2,000 Breach
I wrote about spot gold (XAU/USD) last week, and quite frankly, the yellow metal’s price action still deserves a spot on this week’s Market Insight.
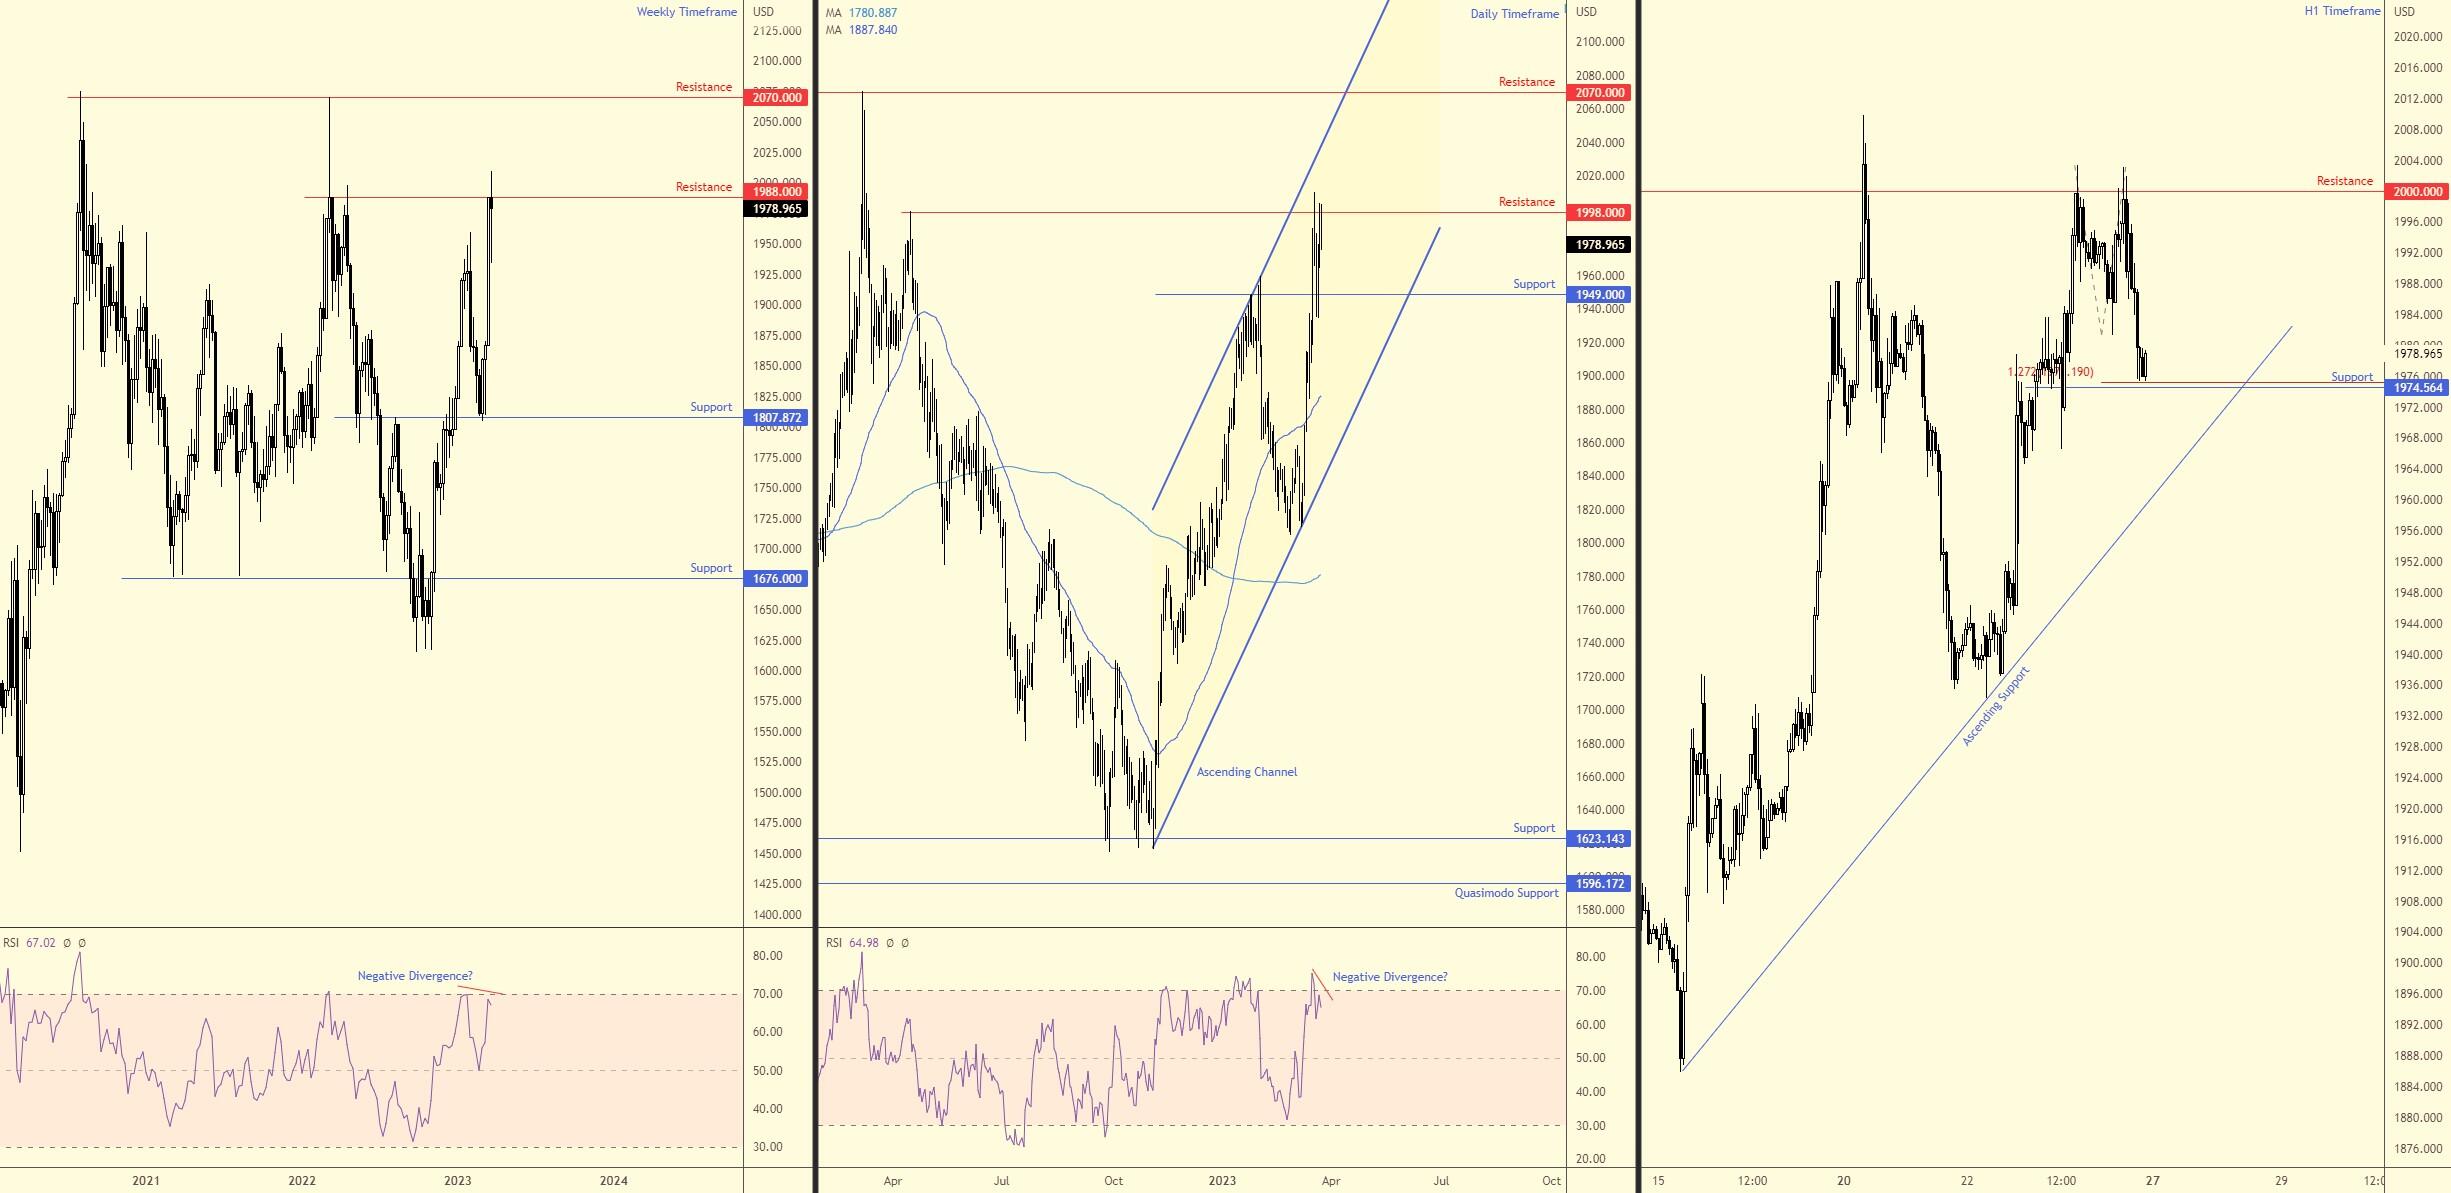
From the weekly timeframe, resistance from $1,988 was key and sufficient to pull in moderate interest from the bears last week, snap a three-week winning streak, and reclaim a small portion of the prior week’s mammoth gain (+6.5%). Weekly support is not seen until $1,807, though support on the daily timeframe has done a superb job supplying this market with a technical floor to work with last week at $1,949. Overhead on the daily timeframe is resistance from $1,998 (18 April top). Upside objectives beyond $1,988 weekly resistance and $1,998 daily resistance is familiar ‘double-top’ resistance at $2,070, visible on the weekly and daily timeframes, which is joined closely with a daily channel resistance taken from the high $1,959.
The weekly and daily timeframes demonstrate clear uptrends (both through price structure and the ‘Golden Cross’ evident on the daily timeframe [50-day SMA crossing above 200-SMA]). Yet, both also show early signs of negative divergence from the Relative Strength Index (RSI) at a time when weekly and daily resistances have made a show, as illustrated above.
Overall, concerning the higher timeframes, the technical pendulum still swings in favour of buyers at this time. For example, in addition to the uptrend, the $1,998 daily resistance has been tested twice and (thus far) failed to generate much selling, meaning it failed to produce sufficient bearish interest to clear $1,949 daily support. As such, buyers are likely to overthrow $1,998 should price remain bullish north of $1,949.
From a shorter-term perspective, price action on the H1 timeframe is nearby support from $1,974, which happens to be accompanied by a 1.272% Fibonacci projection (some Harmonic traders may refer to this as an ‘alternate’ AB=CD pattern). Rebounding from the aforesaid support in early trading this week shifts consideration back to $2,000; a dip lower, on the other hand, may witness buyers embrace H1 ascending support taken from the low $1,885.
So, given the current analysis across all three timeframes, H1 support around $1,974 and the neighbouring H1 ascending support could be a location buyers appear from this week.
Charts: TradingView
Bonds:
AB=CD Bullish Configuration for the 5-Year US Treasury Yield
US Treasury yields bull steepened last week, consequently ending another week lower. Latest developments observed the 10-year benchmark US Treasury yield position itself under its 200-day simple moving average at 3.503%, a signal many technicians recognise as a bearish trend reversal. However, while the longer-dated yields boast appealing price action, this week’s technical radar is on the shorter end of the curve: the 5-year US Treasury yield.
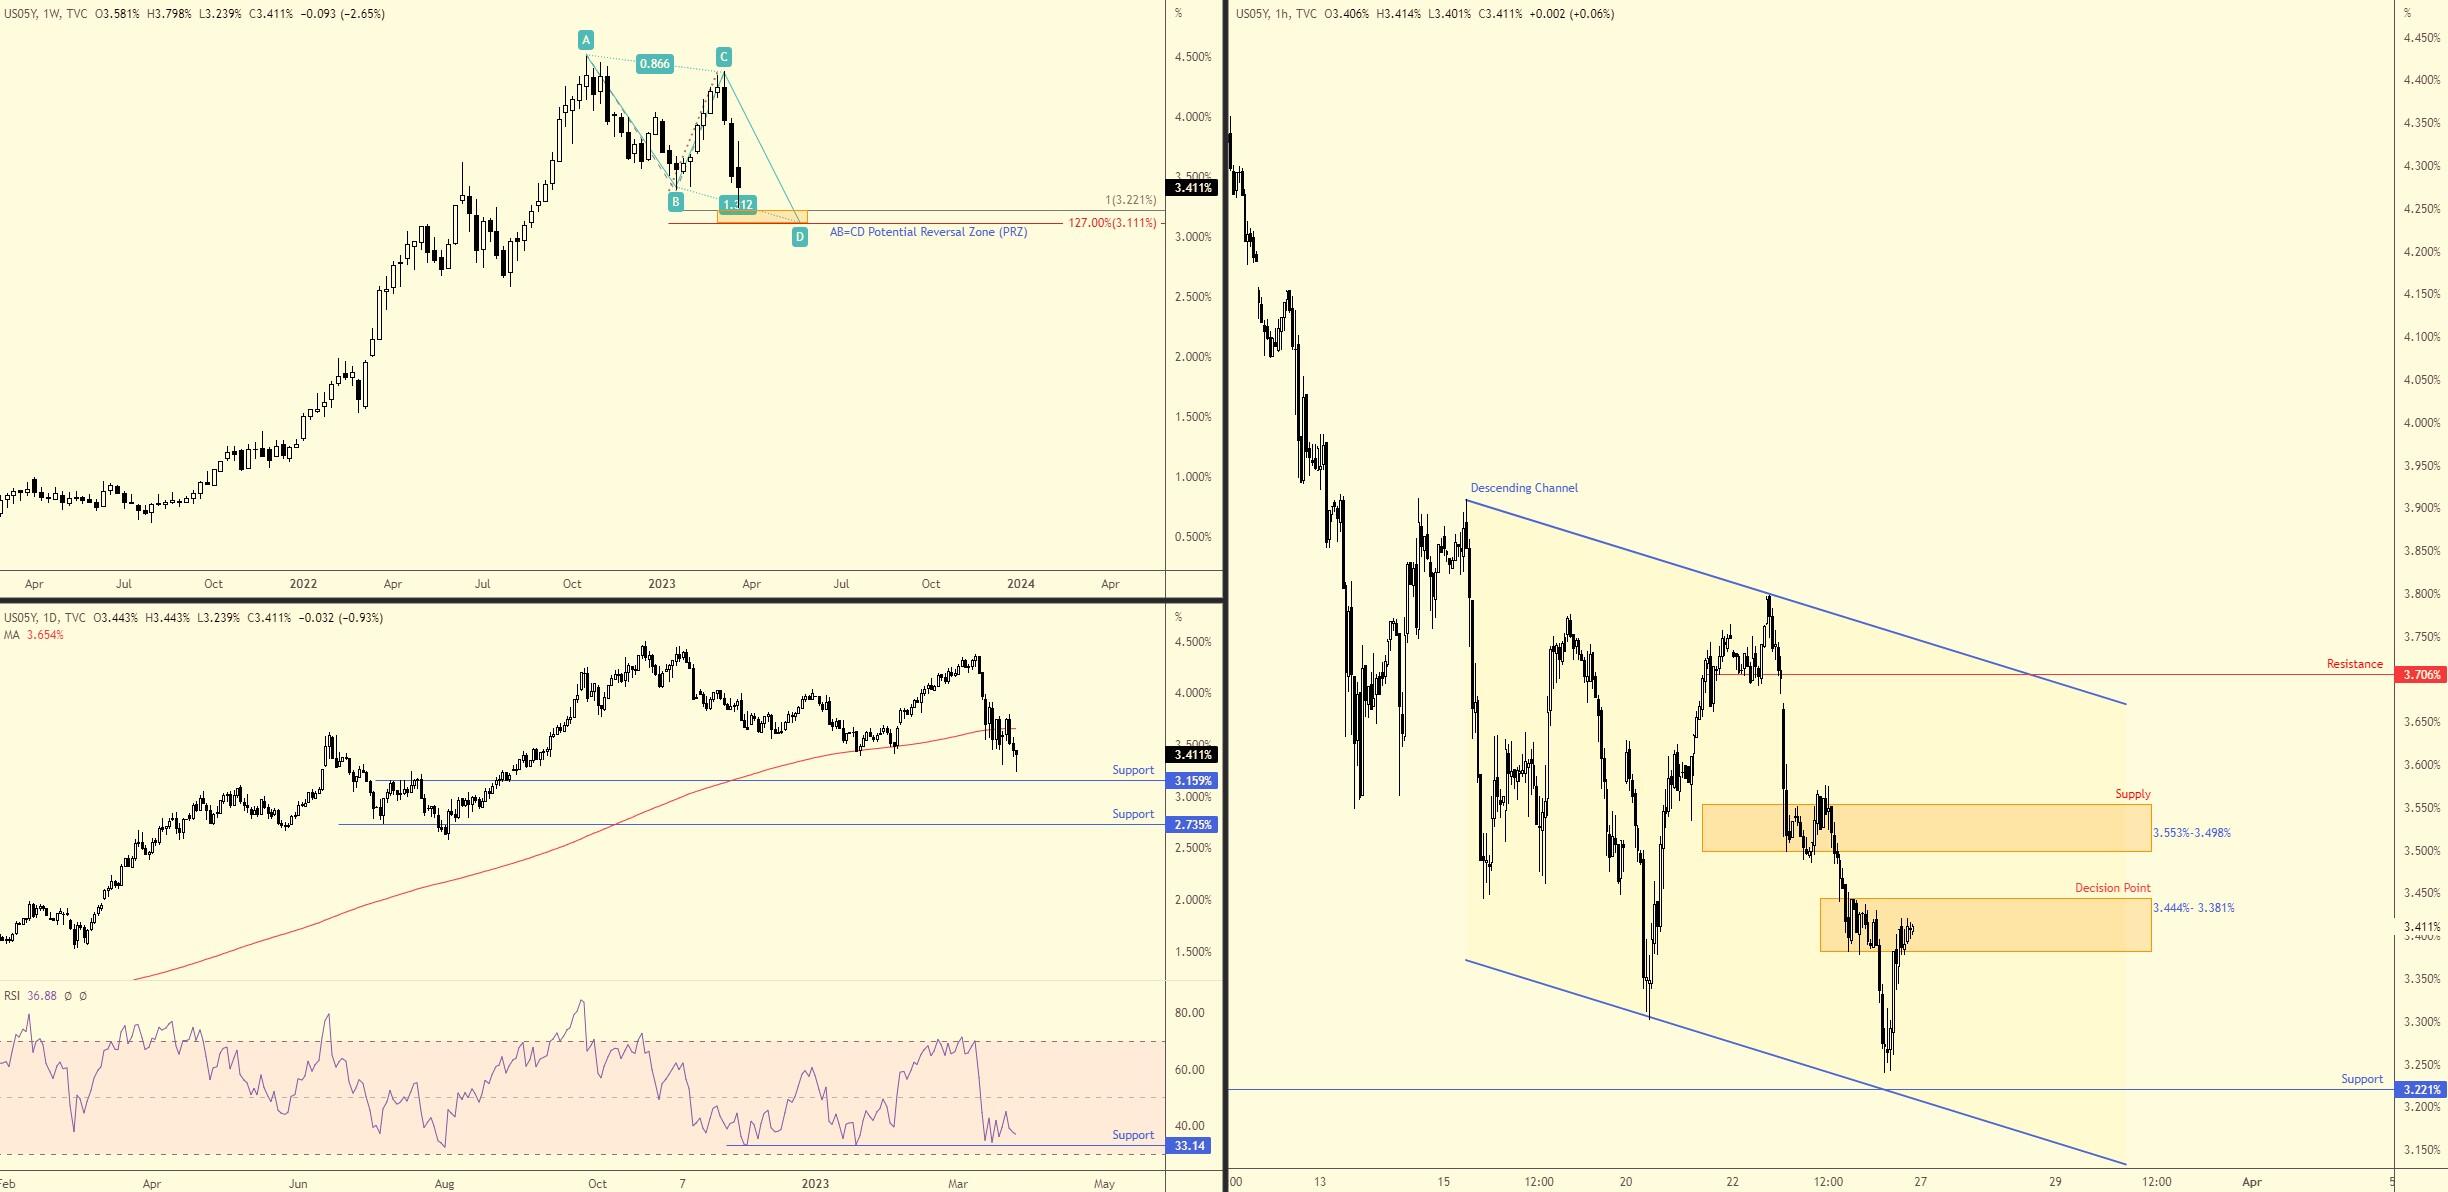
Kicking things off with a look at the weekly timeframe, since October 2022, the price has pencilled in a well-defined AB=CD bullish pattern, serving up a Potential Reversal Zone (PRZ) between 3.111% and 3.221% (made up of a 1.27% Fibonacci extension and a 100% projection). This, together with the weekly timeframe chalking up an unmistakable uptrend since August 2020, marks a key technical floor to be conscious of this week and could prepare the ground for a recovery.
Meanwhile, last week watched price action on the daily timeframe retest the lower boundary of the 200-day simple moving average at 3.654% and deliver dynamic resistance. Moreover, Friday moulded a fresh lower low (shaped as a Japanese hammer candle pattern), visiting levels not seen since August 2022, reaffirming early signs of a downtrend. Downside support targets rest at 3.159% and 2.735%. Since early March, the Relative Strength Index (RSI) has been noticeably exploring space south of its 50.00 centreline. However, it has seen limited movement ahead of indicator support at 33.41 and the oversold threshold in recent trading.
Price movement on the H1 timeframe shows that buyers and sellers settled the week squaring off within the limits of a decision point at 3.444% and 3.381%, following the formation of Friday’s lower low (ahead of H1 support at 3.221%), mentioned on the daily scale. Directly above throws light on supply at 3.553%-3.498%, closely followed by 3.706% resistance and channel resistance drawn from the high of 3.910%.
Interestingly, H1 support at 3.221% aligns with the upper boundary of the weekly timeframe’s AB=CD’s PRZ. As a result, knowing the daily timeframe demonstrates scope to pursue lower levels (next downside support resides at 3.159%), short-term price action suggests sellers may have the upper hand until the H1 support enters the fray. The H1 decision point at 3.444%-3.381% or supply at 3.553%-3.498% could be areas sellers welcome in the short term, targeting H1 support from 3.221%.
Charts: TradingView
Cryptocurrencies:
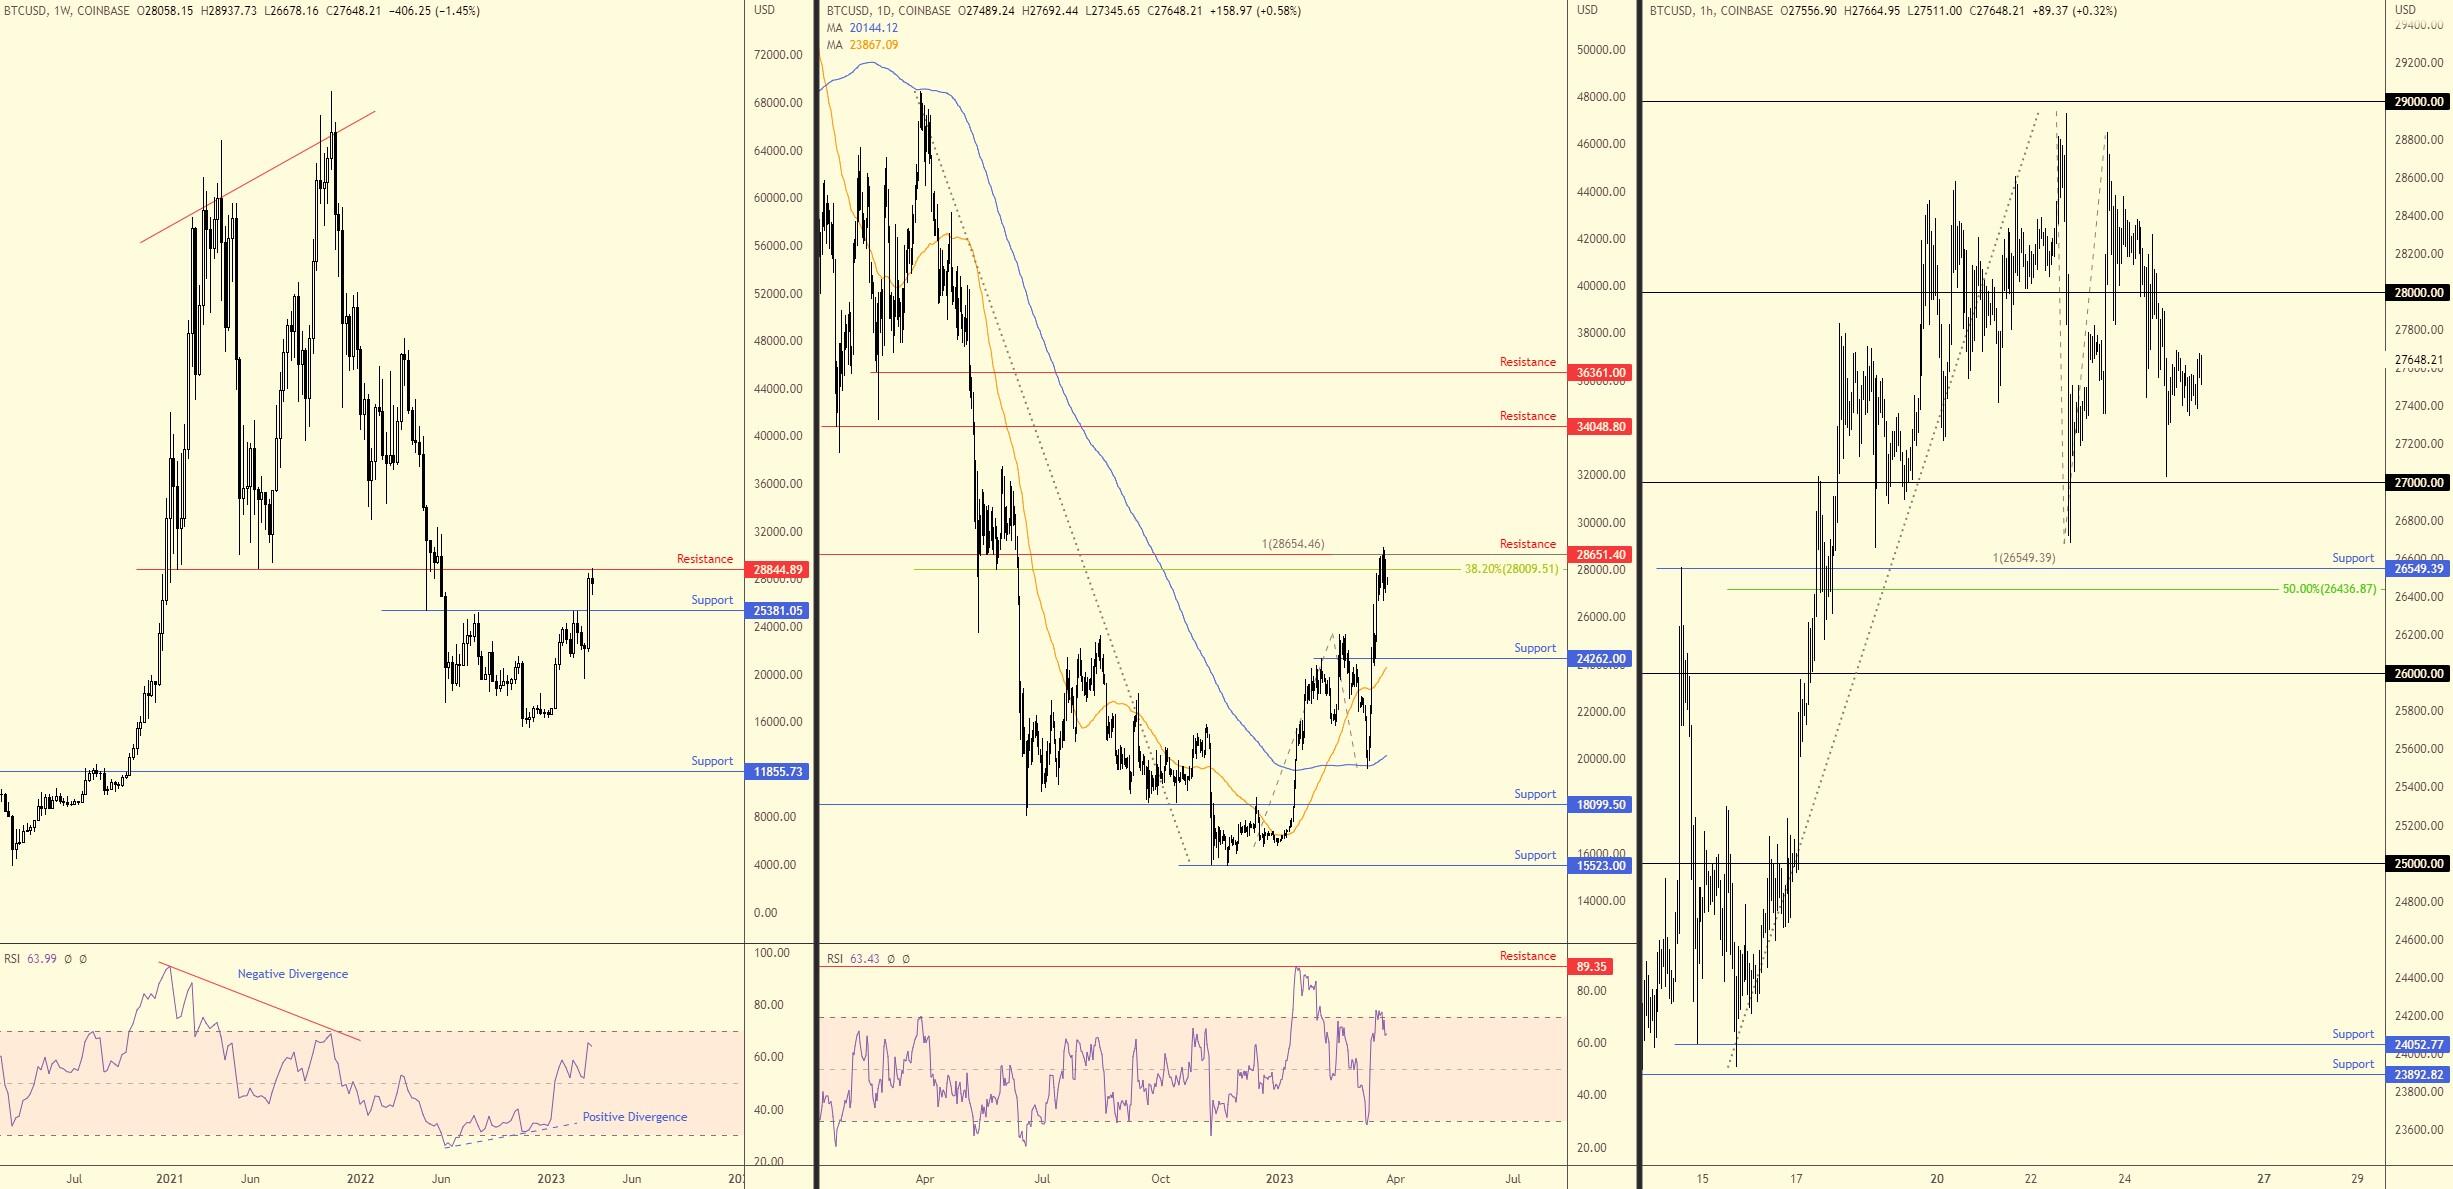
BTC/USD Oversold?
Two central resistances on the weekly and daily timeframes at $28,844 and $28,651, respectively, welcomed price action last week, aided by an oversold signal from the Relative Strength Index (RSI) on the daily timeframe (note that the RSI on the weekly timeframe is considerably above its 50.00 centreline and is venturing close to testing the overbought area). Joining the daily resistance is a 100% projection from $28,654 (many will recognise this as an equivalent AB=CD bearish formation) and a longer-term 38.2% Fibonacci retracement at $28,009. Regarding support, weekly flow has $25,381 on its radar, while on the daily timeframe, we can see support at $24,262. In terms of resistances beyond current resistance, the focus is on the daily timeframe at $34,048.
While we clearly have resistance in play on both weekly and daily timeframes, the trend direction still favours buyers in this market: uptrend.
Looking at the price action from the H1, it is immediately obvious that the $27,000 psychological support is nearby. Space higher up shows $28,000 psychological resistance; a break south of $27,000 points to support from $26,549 and a 100% projection (AB=CD Harmonic support), and a 50.0% retracement ratio at $26,436.
While the uptrend bolsters a bullish scenario from H1 supports, there is a lack of higher timeframe support nearby, and given higher timeframe resistances are active this could weaken current H1 supports and open the door to bearish breakouts this week, targeting $26,000 and perhaps weekly support at $25,381. The latter, of course, is where buyers could indeed make a show.
Charts: TradingView
Author

Aaron Hill
FP Markets
After completing his Bachelor’s degree in English and Creative Writing in the UK, and subsequently spending a handful of years teaching English as a foreign language teacher around Asia, Aaron was introduced to financial trading,


