Dollar strength grips once more across major markets

Market Overview
Immediate fears over the contagion from the economic crisis building in Turkey appear to have been contained as the lira has clawed back at least some of its losses. The rebound has stemmed from the move from the Turkish central bank to reduce the reserve requirements, helping to boost liquidity. The 10 year Turkish bond yield has unwound from an eye watering high of 22.8% on Monday to a marginally less eye watering 20.5% this morning, whilst USD/TRY has unwound from 7.21 to 6.30 this morning. But, whilst, this may have helped to improve risk appetite to an extent, with the safe haven yen giving up gains and Treasury yields a few basis points higher, the strength of the dollar is still major theme that is hitting throughout markets. The concerns remain across emerging markets, reflected in the continued slide of the Chinese yuan. The offshore rate (USD/CHN) is back above 6.90 and is at its highest level since March 2017 this morning. This plays into continued dollar strength, whilst limiting any near term technical rally that had been threatening on forex major pairs against the dollar and equities. The trend of dollar strength is one to stick with for now, it would seem.

Wall Street rebounded yesterday with the S&P 500 +0.6% at 2840, however futures are back lower today and Asian markets have suffered again overnight (Nikkei -0.7%). European markets are mixed in early moves. In forex, it seems that the rallies on major currencies against the dollar have been somewhat short lived and whilst the dollar strength is not enormous today, it is still broad across the majors. It is also notable that the commodity currencies (AUD, NZD especially) are under the most pressure. In commodities a stronger dollar is bad news for gold, which is decisively breaking supports and down another -$5 (-0.5%) this morning. Oil has also slipped back in early move after the API oil inventories showed a surprise crude build yesterday.
It may be a French and Italian public holiday today (for Assumption Day), but today is the most interesting day for the economic calendar this week, with UK inflation and US retail sales on the agenda. UK CPI is at 0930BST and is expected to tick higher on the headline CPI to +2.5% (from +2.4% in June) with core CPI expected to remain at +1.9% (+1.9% in June). Given that ex-bonus wages stayed flat at +2.7% yesterday, this headline tick higher would reduce the tiny real wage growth being seen currently. Also look out for the PPI Input prices which are expected to tick higher to +10.4% (from +10.2% in June) which would be a fifth consecutive month of rise. Into the afternoon there is a clutch of US data, but the most important is the US Retail Sales at 1330BST which are expected to grow by +0.3% in the month of July on an ex-autos basis (+0.4% MoM in June). The New York Fed Manufacturing is at 1330BST and is expected to slip slightly to a still strong +20.0 (from +22.6 last month). US Industrial Production is at 1415BST and is expected to grow by +0.3% for the month (+0.6% MoM in June), with Capacity Utilization improving back to 78.2 (from 78.0) which is again the highest since February 2015. The EIA Oil Inventories are at 1530BST and are expected to show a crude oil drawdown of -2.5m barrels (-1.4m barrels last week), with distillates +1.0m (+1.2m last week) and gasoline at a drawdown of -1.0m (+2.9m build last week).
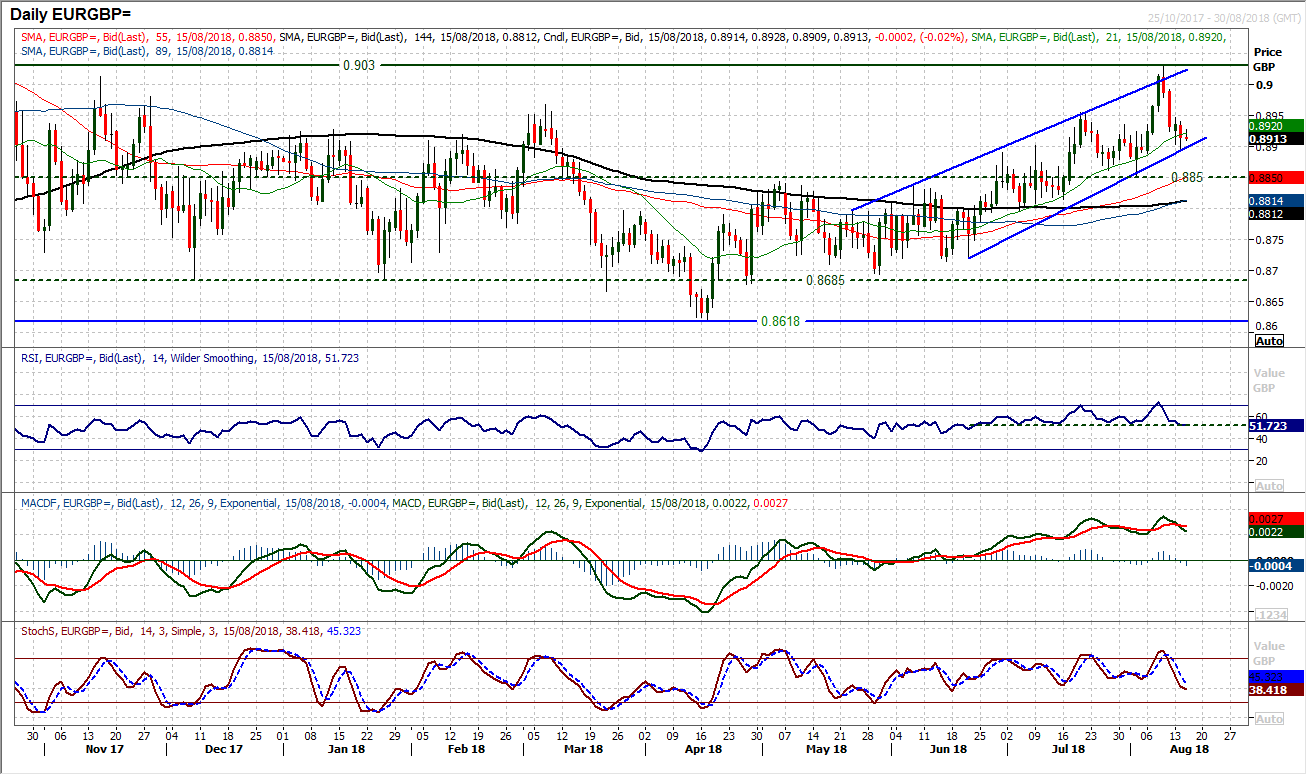
Chart of the Day – EUR/GBP
The breakout above £0.9000 could not be sustained as the euro was hit by the threat of Turkey contagion, however this move has simply unwound EUR/GBP within a two month uptrend channel and now sits at a bit of a crossroads. The bottom of the channel was used as a basis of support from yesterday’s low at £0.8920 and although there was a negative close to the session, it looks as though support is ready to form. The momentum indicators have unwound to levels where the buyers have been tempted again during this two month uptrend channel, with both RSI and Stochastics around 50. Is this a chance to buy? It will be worth watching the rising 21 day moving average (today at £0.8920) which has been a good basis of support in recent weeks. The channel is supportive around £0.8900 today whilst the August low at £0.8853 is a key higher low now. A renewed positive signal around current levels would certainly be seen as another chance to buy. A close back above the old resistance around £0.8950 re-opens the highs again at £0.9030.
EUR/USD
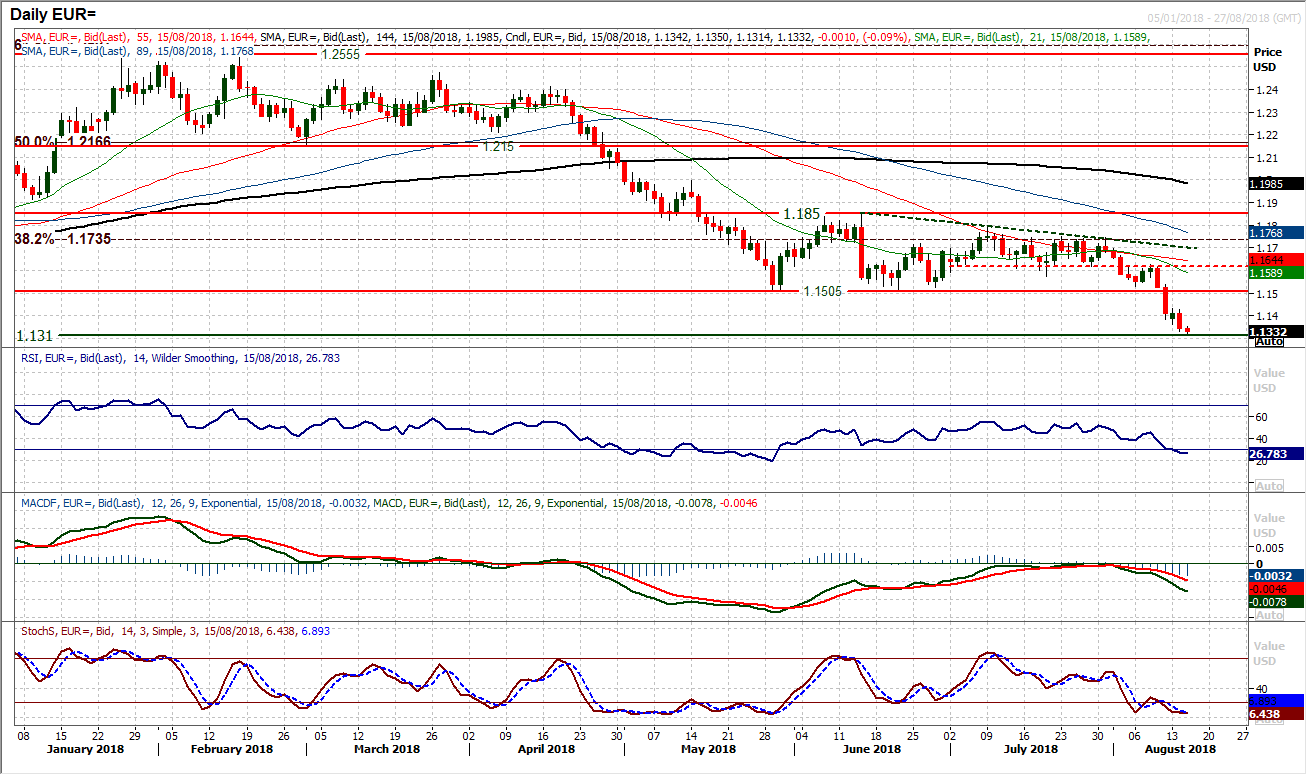
It seems that there has been little respite for the euro as all sense of a near term technical rally was quickly snuffed out yesterday. Another decisive bear candle dragged EUR/USD ever lower and the market is testing the next (minor) support at $1.1310 this morning. What could have been a positive signal on the RSI during yesterday’s early rebound, has been quickly switched and the outlook suggests there is room in this big bear phase for further weakness. The May sell-off saw the RSI down below 20 before a recovery set in. However, with MACD and Stochastics lines both bearishly configured and showing little sign of positivity, trading with the trend is the lowest risk play still. A breach of $1.1310 and the market is then into an old trading band $1.1100/$1.1280 from May/June 2017, however, it is difficult to see this as decisive support now. The 23.6% Fibonacci retracement at $1.1202 of the massive euro sell-off from the ECB’s asset purchase programme is a basis of potential consolidation. The hourly chart sows initial resistance now $1.1365/$1.1435 under the now key resistance at $1.1505.
GBP/USD
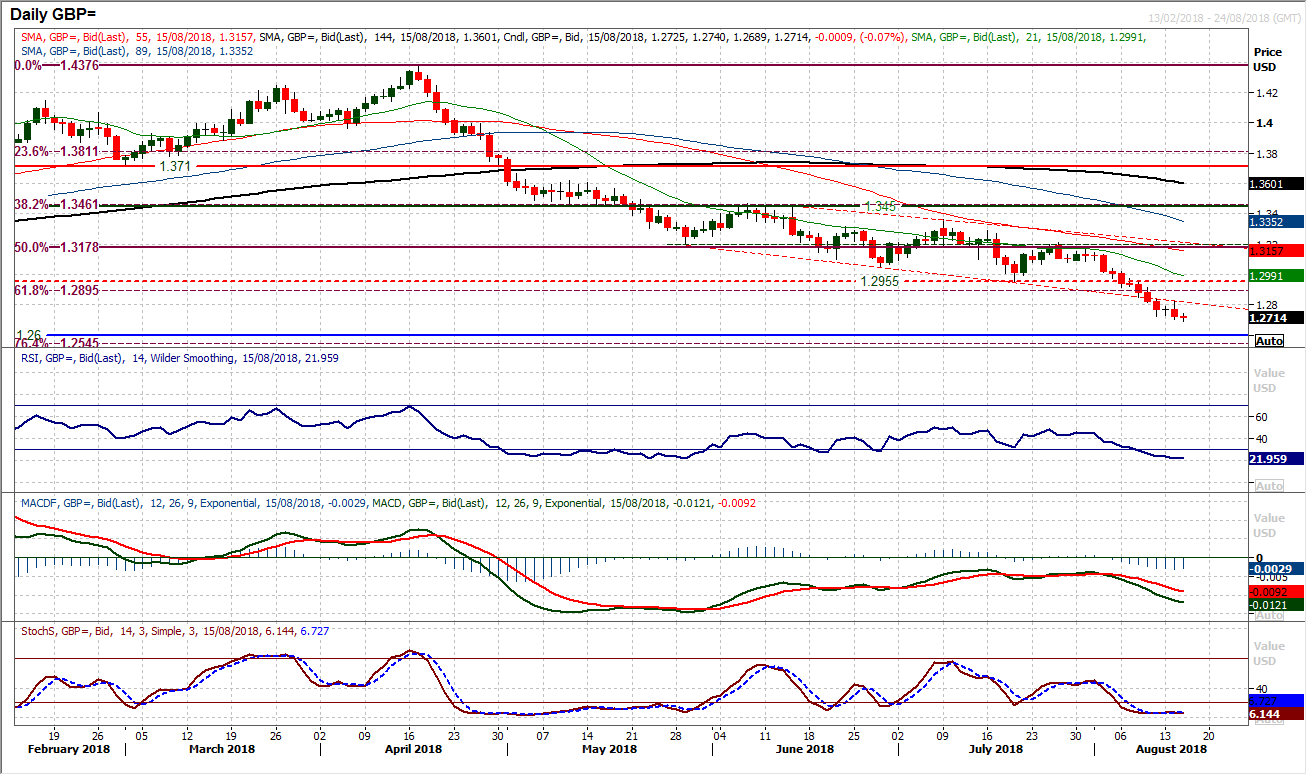
With the enduring dollar strength, perhaps we should not be surprised that an initial intraday rebound during yesterday morning has been decisively sold into once more. Cable remains bearishly configured and completely a sell into strength. The market is now well clear below the downtrend channel, whilst any semblance of old support is doing little to hold up the selling pressure. As the market continues to fall today, perhaps it might be a momentum driven rally that saves sterling from further pain. The RSI is down into the low 20s. However this simply reflects the strength of the trend and during the last significant bear run in May, the RSI spent over four weeks camped below 30. In fact, yesterday’s reaction to a mini rebound probably adds to the bear pressure, leaving resistance at $1.2825. The June 2017 low around $1.2600 is a major support area, and with the 76.4% Fib level at $1.2545, this could be an area where consolidation begins to form.
USD/JPY
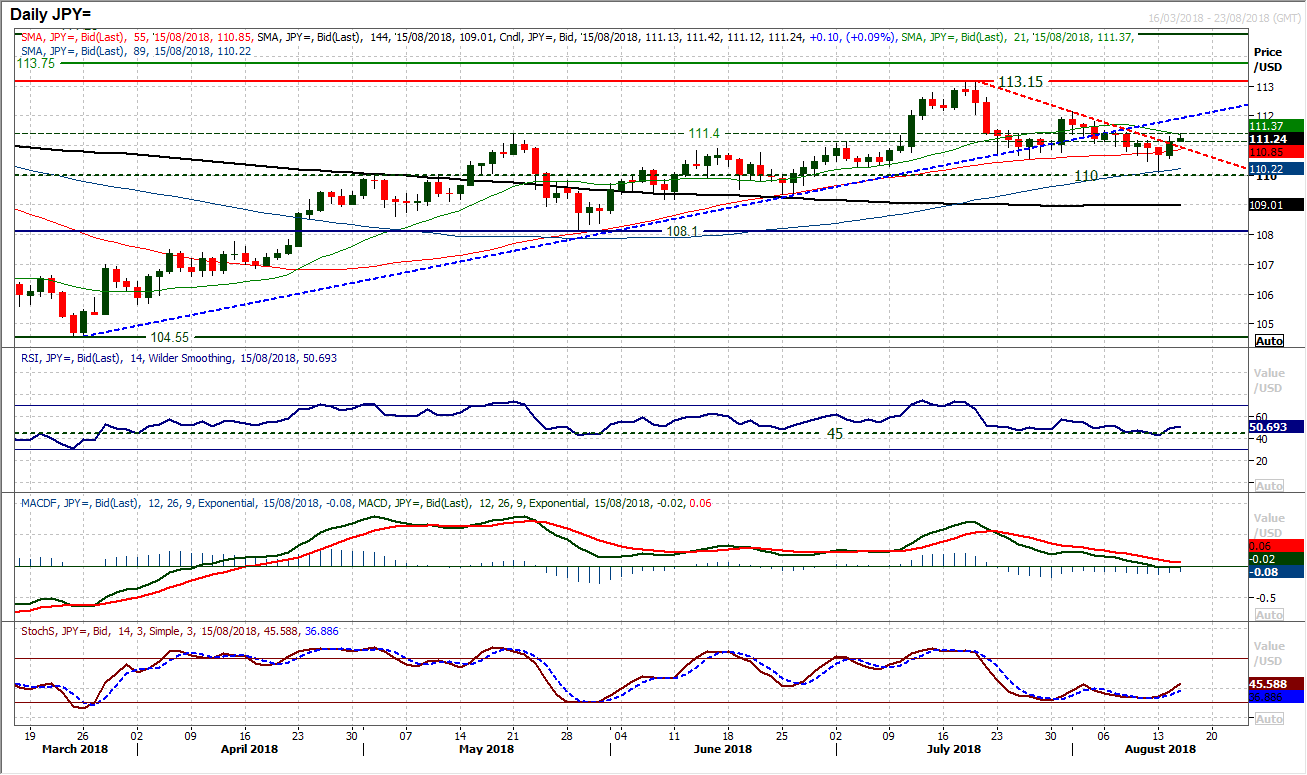
The dollar bulls have fought back once more and as the sentiment surrounding Turkey has improved a shade in the past 24 hours we have seen Dollar/Yen picking up once more. A decisive bull candle and further gains today has now broken the three week corrective downtrend to improve the outlook once more. It seems as though there is a constant battle for control between the dollar and the yen, and subsequently, the market is losing trend again. After the 4 month uptrend was broken, the sellers have failed to grasp control and what is increasingly taking hold now is a market of consolidation. A reaction low at 110.10 is in place now, and it will be interesting to see how the dollar bulls react to the old pivot band 111.15/111.40 which has previously been like a magnet to the price over recent weeks. The reaction high at 112.15 now needs to be broken on a closing basis for upside direction. For now the bulls have the near term direction, with the upswing on the Stochastics. However consolidation is reflected in the MACD lines plateauing at neutral and RSI fluctuating around 50.
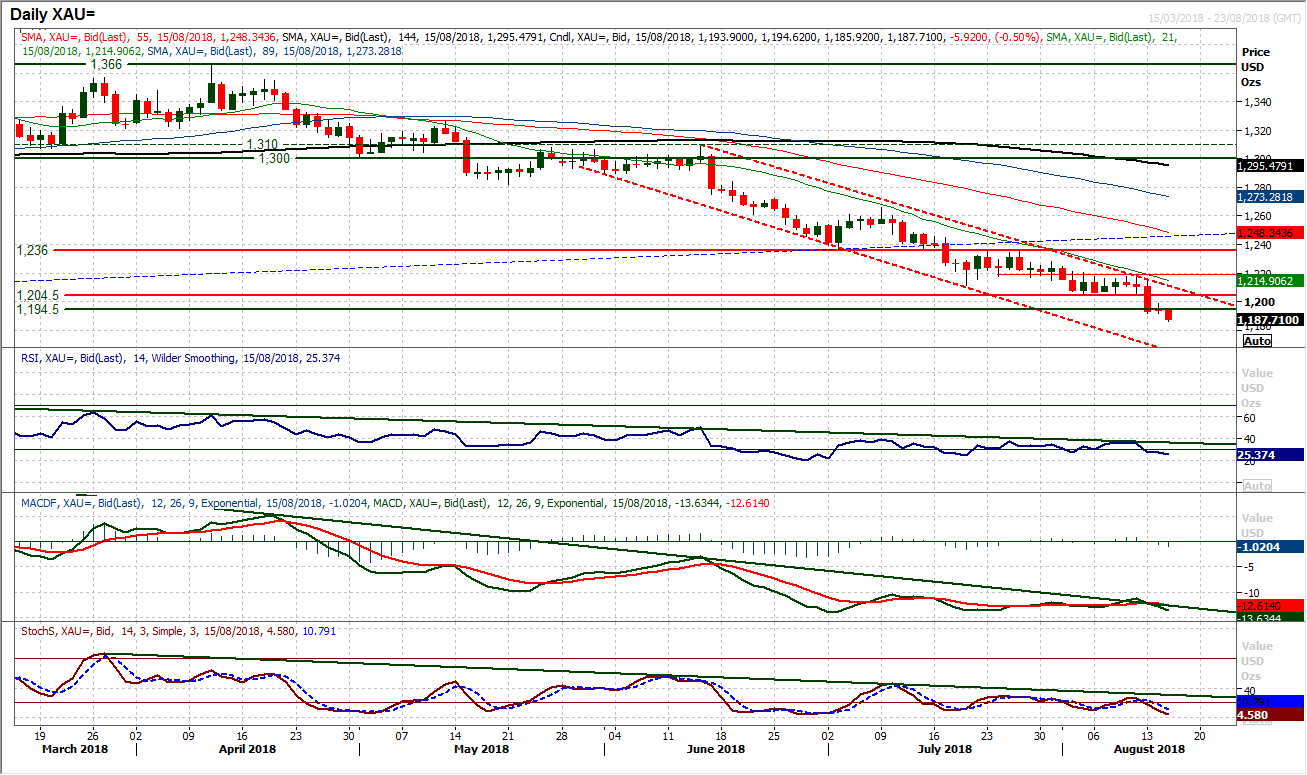
Gold
Following Monday’s decisive bear candle which once more ended a consolidation with a downside break, the outlook has taken on renewed negativity. Breaching the old support at $1204, the market has quickly broken $1194.50 and is now on its way to testing $1180. The worry is that with momentum gaining renewed bearish vigour now, there is little beyond $1180 to prevent a full retreat to the crucial December 2016 low of $1122. Intraday rallies remain a chance to sell with momentum indicators reaffirmed in their bearish configuration. Furthermore, the $1194.50/$1204 old supports now become overhead supply as new resistance. The barrier to a recovery is huge. The hourly chart shows initial resistance $1191/$1198 with any rebound of note seen as a chance to sell still.
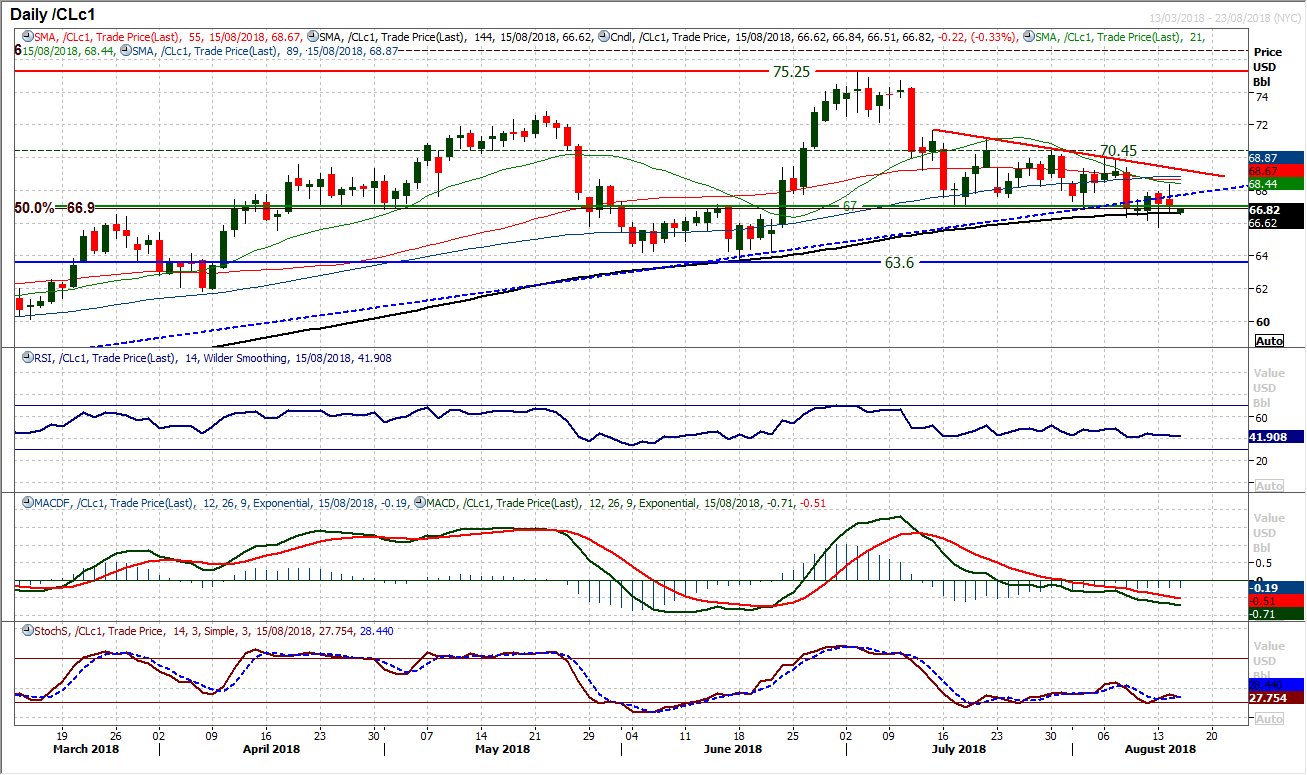
WTI Oil
There is still a corrective outlook on oil as the market again gravitates back towards the $67 pivot again. The concern is that this is now a second bear candle this week and a failure at $68.35, this could be the lower high again within the downtrend of the past few weeks. With momentum indicators retaining their negative bias of the past few weeks, there is a trend of selling into strength. With an early dip below the pivot this morning, a decisive close below $67 would be a key move and open the June low at $63.60. The hourly chart reflects a bear bias and support at $65.70.
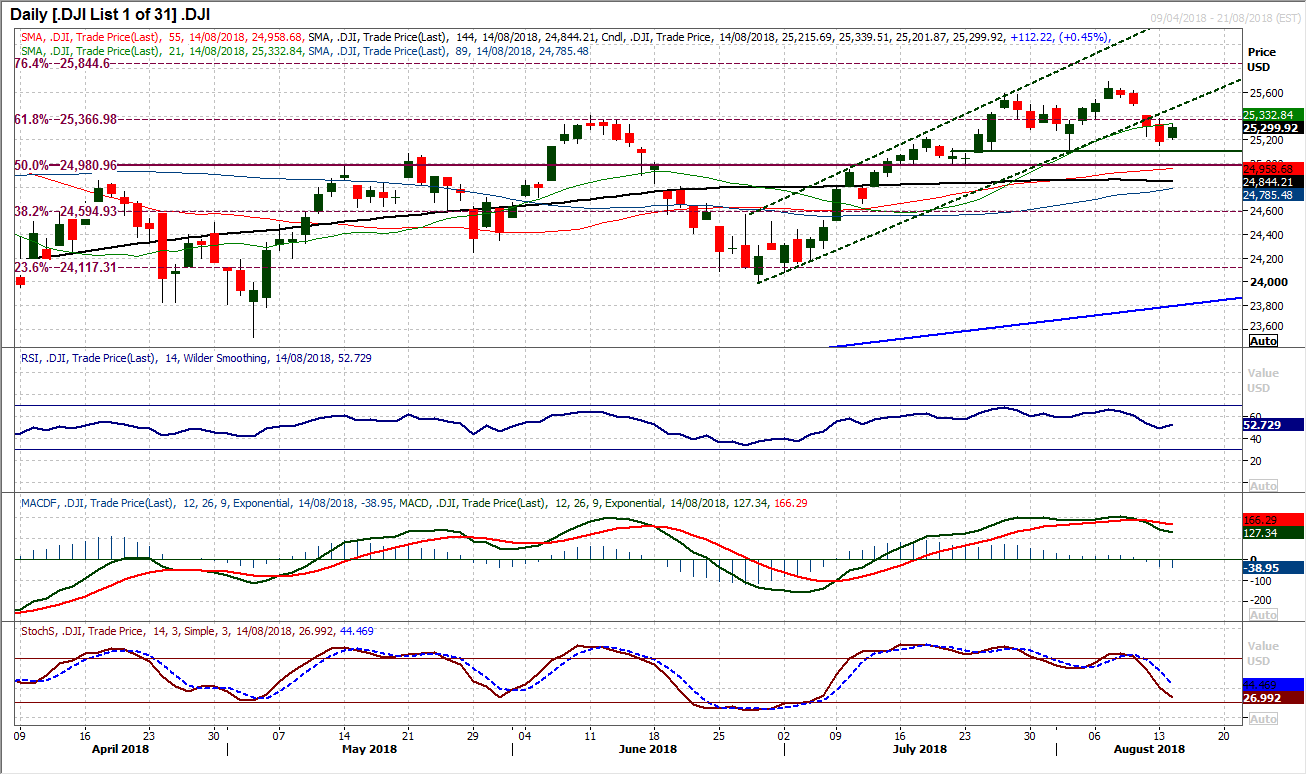
Dow Jones Industrial Average
The Dow has managed to post a positive candle and this has put the brakes on a recent corrective phase, however the bulls have got far more to do in order to regain control. The support at 25,120 remains intact, but the market remains under the 61.8% Fib retracement (at 25,367) for a second day and below the underside of the old uptrend channel which is now a basis of resistance. The momentum indicators continue to slide lower in corrective mode, with the MACD lines having bear crossed and the Stochastics negatively configured now. In reaction to this positive candle yesterday, if the market now begins to fall over again then a concerning corrective outlook will continue to build. In this scenario, the support at 25,120 will be increasingly important. There is a gap still unfilled at 25,493 with initial resistance today at 25,401.
Author

Richard Perry
Independent Analyst


