Dollar strength continues amidst continued economic outperformance

Market Overview
As US economic data continues to hold up relatively well against other major economies, the dollar continues to perform well. Although not tier one data, this was laid bare once more yesterday as data releases from the US and Eurozone put the two economies on seemingly divergent paths. Eurozone consumer confidence posted a big miss, whilst US New Home Sales posted a big beat. In the past month, the US trade weighted Dollar Index has strengthened around 2%, as a string of positive data has driven consistent upward revisions of Q1 GDP. In that time, the Atlanta Fed’s GDPNow forecast has gone from around +0.5% to +2.8%. Traders are clearly anticipating an encouraging number now in Friday’s Advance GDP release. This has been as the Eurozone has posted continued economic struggles. Even overnight, Australian inflation (RBA trimmed mean) missed expectations in Q1 drifting back to +1.6% (+1.7% expected, +1.8% in Q4 2018). This will increase pressure on the RBA for potential easing measures. Bond yield differentials have widened in the favour of the dollar and gold is at four month lows. However, perhaps the most impressive move is in equities. The S&P 500 finished the session last night with an all-time closing high. This relative outperformance of US economy will not last forever, but certainly for now there is a sweet spot for the dollar.

Wall Street closed with strong gains last night in a move which saw the S&P 500 +0.9% and at 2933, beating its previous closing high of 2931. There is a degree of consolidation this morning as US futures are a shade lower at -0.1%. This has tempered the moves in Asia, with the Nikkei -0.3% and Shanghai Composite -0.3%. European markets look similarly cautious, with FTSE futures -0.1% and DAX futures -0.2%. In forex, the continuation of USD gains rolls on, with the main underperformers being on the AUD (down -0.9% after the inflation slide) and NZD -0.5%. However, it is interesting to see that JPY continues somehow rebuff a surging dollar. Commodities are a little mixed today with gold a touch lower by -$1, whilst oil is just slipping back after a big run higher earlier in the week.
Early in the European session there is a key focus on a key indicator for the health of the German economy. The German Ifo Business Climate at 0900BST began to tick higher last month and is expected to improve again to 99.9 in April (up from 99.6 in March). It is also worth keeping an eye on the Ifo Current Conditions too which is expected to improve to 103.8 from 102.6 last month. The UK public borrowing requirement for March is at 0930BST and is expected to be -£0.4bn (-£0.3bn in March 2018). The Bank of Canada monetary policy decision is at 1500BST and is expected to show no change on rates at +1.75% (+1.75% in March). The EIA Oil Inventories are at 1530BST and are expected to show a crude oil drawdown of -0.2m barrels (-1.4m barrels last week). Distillates are expected to drawdown by -1.3m barrels (-0.4m last week) and gasoline expected to drawdown by -0.3m barrels (-1.2m last week).
Chart of the Day – Silver
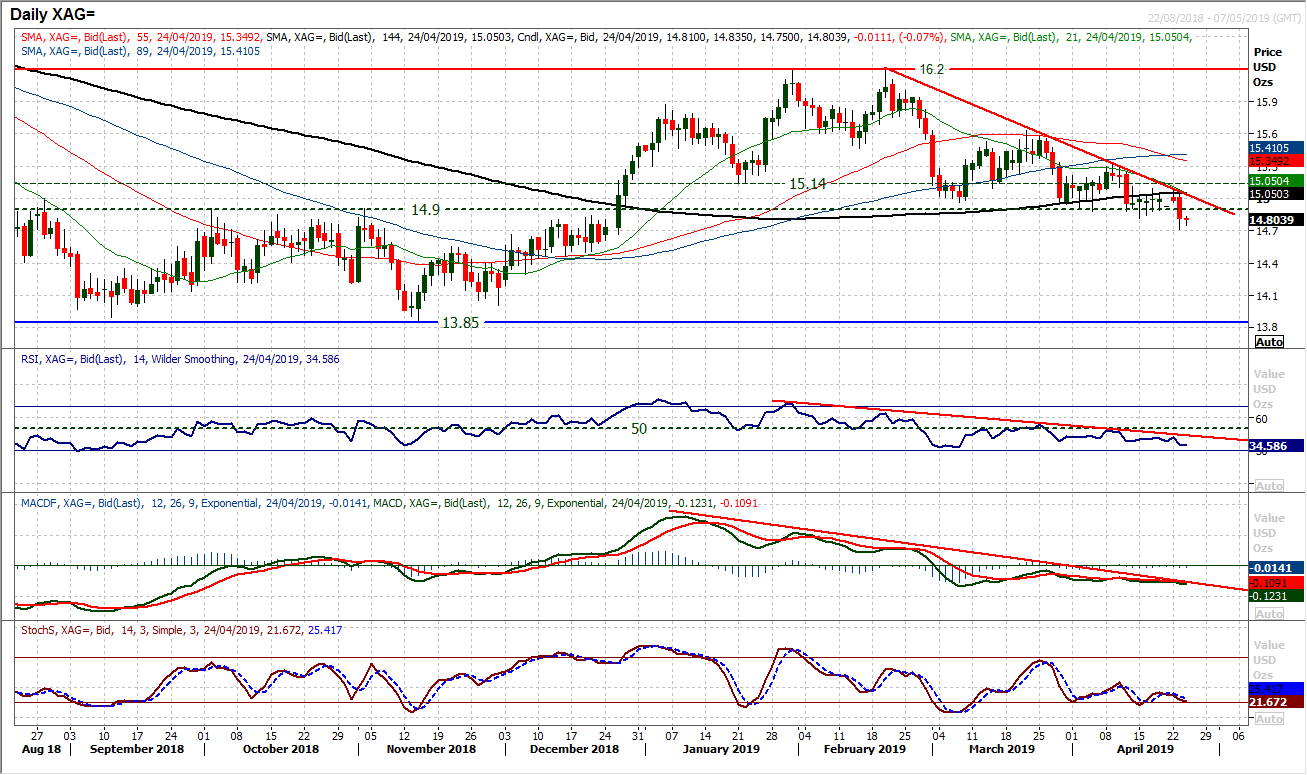
Silver has been tracking lower in a downtrend for the past nine weeks. The pressure has been mounting on the long term pivot at $14.90 in the past week and has now finally given way. A close below $14.90 with a decisive bear candle has seen silver close at a four month low and opens further downside. This comes with confirmation on momentum indicators, amidst bearish configuration across MACD, RSI and Stochastics. Furthermore, these momentum indicators have just turned lower to give bear signals with additional downside potential. The resistance of the downtrend comes in at $15.04 today meaning that with the overhead supply of $14.90 there is a near term sell-zone between $14.90/$15.00. The hourly chart shows consistent failure of the hourly RSI between 55/65 throughout the past month, something which suggests using intraday rebounds as a chance to sell. Trading below the breakdown opens the next support at $14.46 but there is little real support until the key band from Q4 2018 between $13.85/$14.00.
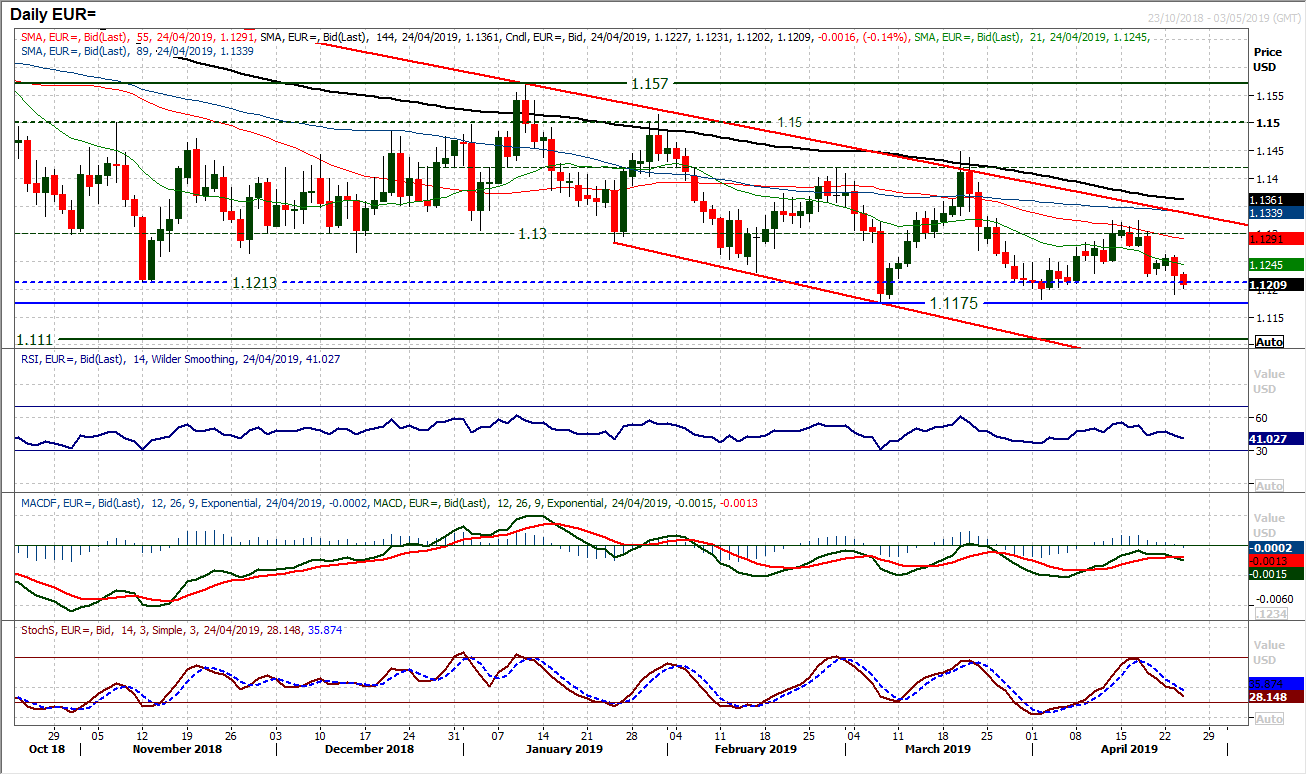
The euro remains under pressure as the dollar strength pulls EUR/USD lower. We discussed previously about how important yesterday’s session would be in the wake of the Easter lull. The sellers came back in force to form a strong bear candle and the move continues today. Turning lower once more is having a significant impact on momentum too. Having tailed off recently below neutral, the MACD lines are now forming a bear cross. Coming with the Stochastics and RSI deteriorating again, this is a cause for significant bull concern. Although the market bounced from $1.1190 yesterday, expect further pressure on $1.1175 the crucial March low. A breach would take the euro to its lowest since June 2017 and open $1.1100 and perhaps even $1.1000. Price action of the past couple of weeks suggests that rallies continue to be treated as a chance to sell. Resistance is now growing around $1.1260.
The positive medium term technical outlook has broken down. Cable trading below $1.3000 has turned the market corrective. The fact that the market had a bull failure of a move back above $1.3000 to leave resistance at $1.3020 just adds to the growing sliding feel to the pair now. The old floor of $1.3000 is now a key area of overhead supply with a resistance band $1.3000/$1.3030. Breaching $1.2945 also opens an old pivot band around $1.2815 and the February lows at $1.2770. Momentum is very negatively configured to suggest that intraday or near term rallies are a chance to sell now. The growing resistance of the now six week downtrend is at $1.3050 now.

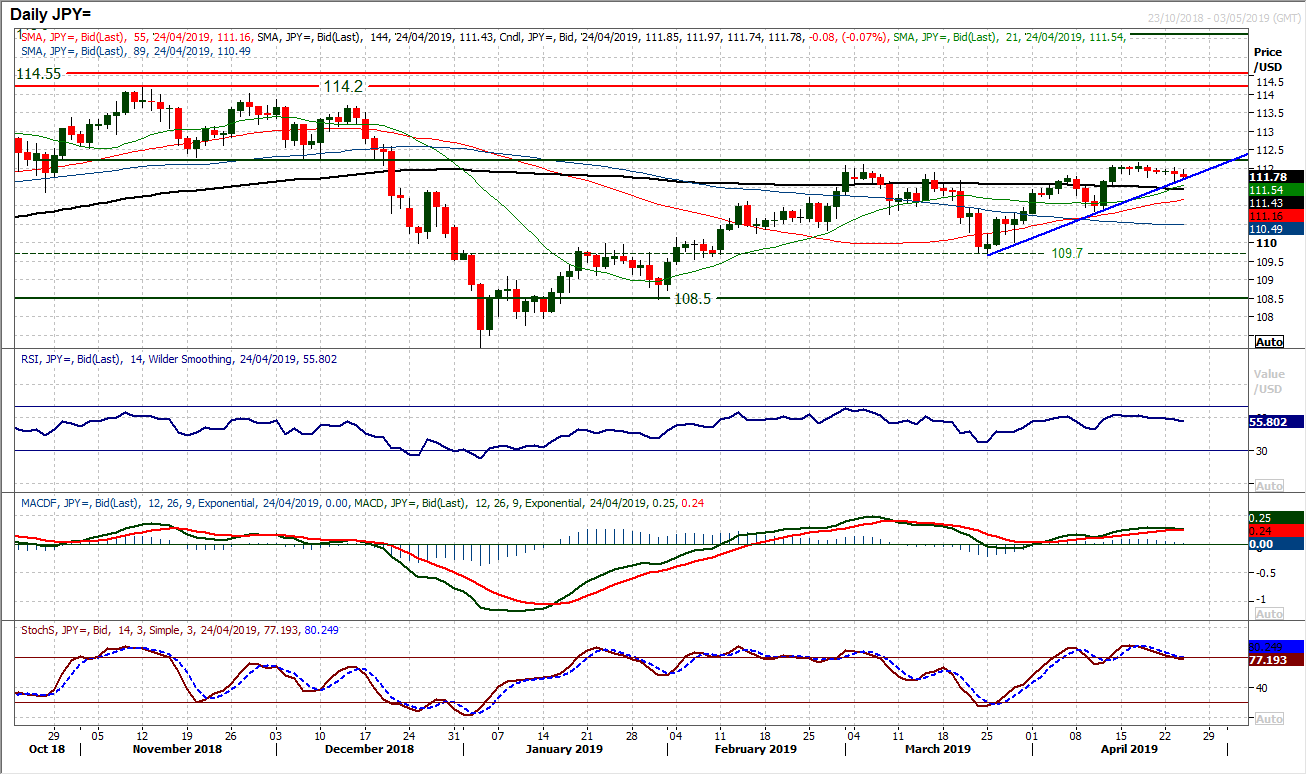
The market continues to drift with little direction. In the past week and a half the market has closed every session with a small real body candlestick and within 20 pips. The move mas drifted the market back to the support of a four week uptrend. This move has allowed momentum to unwind slightly and should be the source of the next move higher. However, there is still seemingly a big barrier to overcome. Resistance around 112.20 is becoming a key medium term pivot. For now the market is in consolidation mode, something reflected in very benign hourly chart momentum configuration. However, there is still a band of support 111.60/111.80 holding up the market. Breaching 111.60 would now be a disappointment, with further support at 111.20, whilst the bulls would lose control below 110.85. A close above 112.20 re-opens towards 113.70/114.00.
Gold
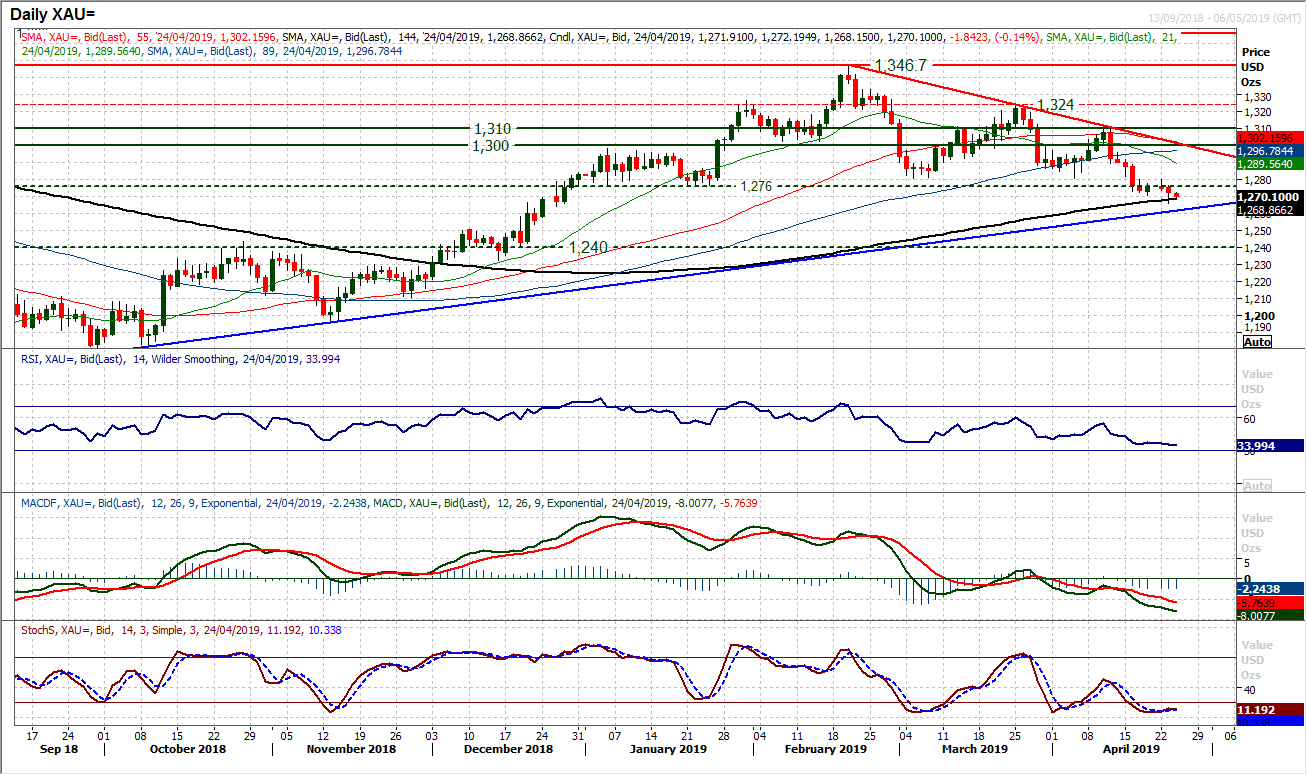
A breakdown below $1276 resulted in some consolidation in front of Easter, but once clear of the holiday period, traders have returned to drag the price down once more. Another positive long term signal was breached yesterday as the 144 day moving average (c. $1268) and now the market is on its way towards a key test of the eight month uptrend at $1261.50. This trend is the final realistic argument for long term bull control which is now close to being broken. Momentum is increasingly negatively configured and does not bode well for the bulls. Chiefly, the RSI is in the low 30s (eight month lows) but considering the bear market moves of April to July 2018 saw the RSI in the low to mid-20s, there is further downside potential. The MACD lines accelerating lower also confirms this. Near term technical rallies are now a chance to sell, with the overhead supply between $1276/$1280 a considerable barrier. Initial support at $1250 but the pivot around $1240 is also open.
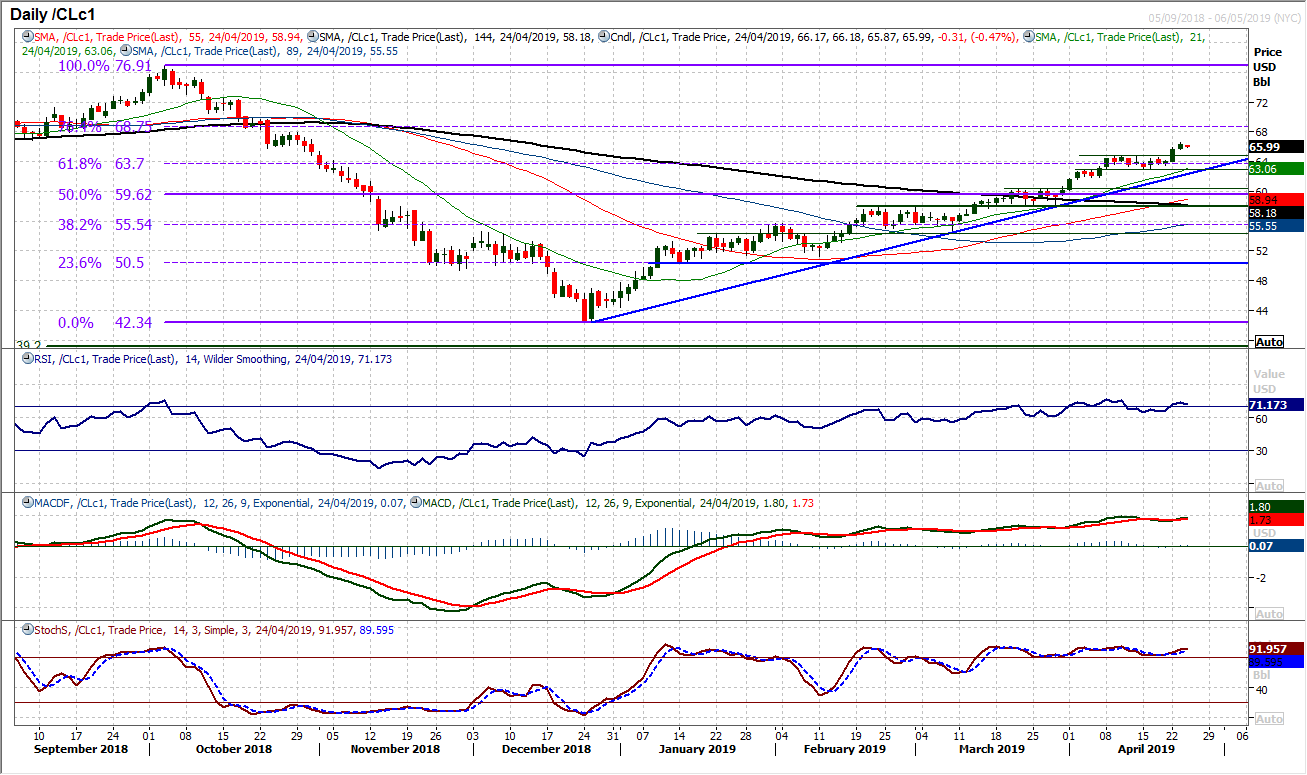
WTI Oil
Having broken out above $64.80 the bulls are strong again. A breakout target of $66.60 is unlikely to restrict the move as the run eyes further resistance levels within the old October/December sell-off of $76.90/$42.35. A 76.4% Fibonacci retracement of this decline comes in at $68.75 whilst $67.95 is initially resistance. Momentum is clearly very strong here, with the MACD and Stochastics swinging higher again. The RSI is also back into the low 70s. However, this could begin to restrict the immediate upside move in the coming days, something that is hinted early this morning. The April rally peaked around 76 on RSI before consolidation set in. However, consistently we see consolidations on WTI are simply moves to unwind overbought momentum and are subsequently seen as a source of the next chance to buy. The breakout levels are also then a basis of support, meaning $64.80 is an initial support. The support at $63.00 is also a key higher low, whilst the four month uptrend is further support at $62.30.
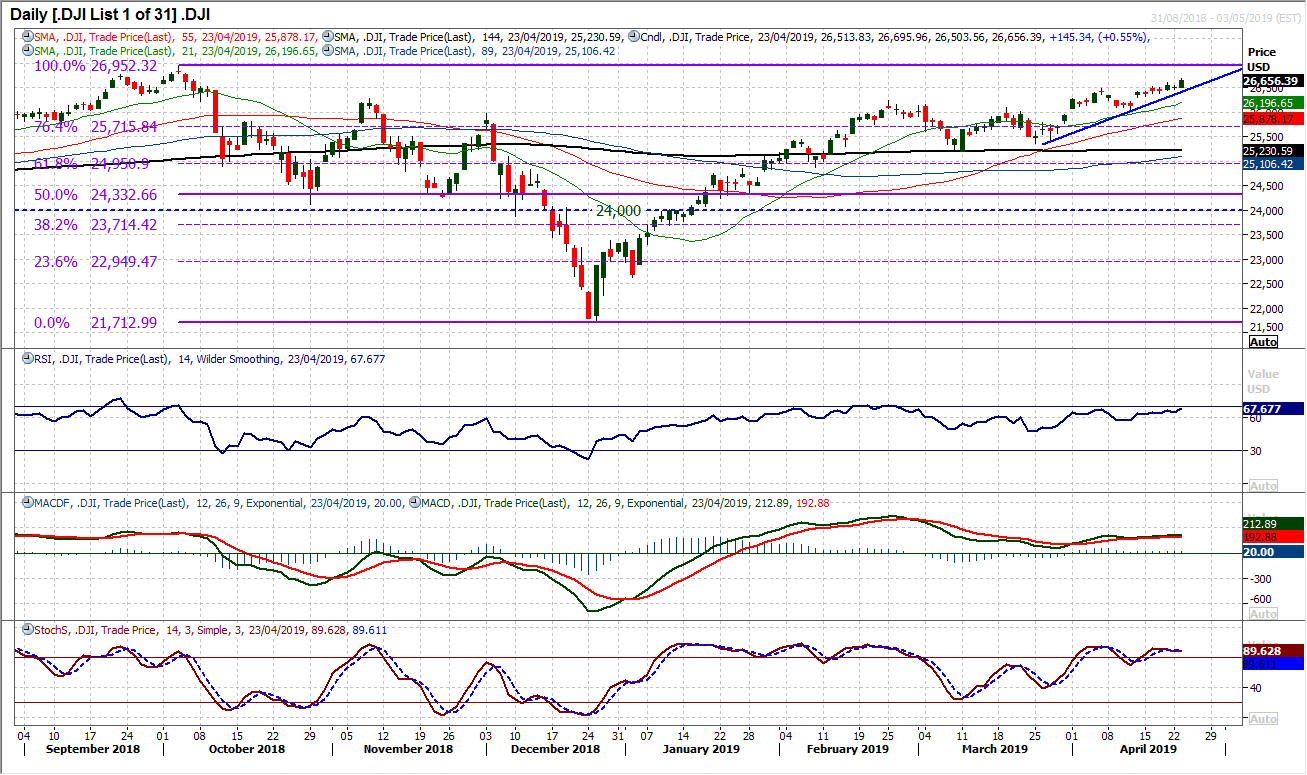
Dow Jones Industrial Average
US equities remain strong and the Dow continues to pull higher within its four week uptrend as the bulls eye a retest of the all-time high at 26,952. Yesterday’s solid bull candle suggests the market is now positioned for the move. The strength of momentum indicators would suggest this is the preferred outlook. The RSI is strong and pushing on towards 70, whilst MACD lines also edge higher. Intraday or near term weakness is a chance to buy, with the uptrend a prime basis of support now. The uptrend supports at 26,485 today. Another close at multi-month highs now means that the Dow is just over a percent away from the key October high. Initial support is at 26,390.
Author

Richard Perry
Independent Analyst


