Dollar remains under pressure after dovish FOMC minutes
Market Overview
Stubbornly low inflation is a key factor that could prevent the FOMC from achieving its possible three rate hikes next year. The FOMC minutes last night suggested that many members expected rates would rise in the “near term” meaning that a December hike is a done deal. However this was already factored in by the market and focus was far more on future rate hikes further out. The concern that some members were concerned over the inflation outlook has shaken the market. This dovishly reflects the views of Janet Yellen a couple of days ago and means that the Fed will be highly data dependent now. Any sign that inflation is not picking up will now hit the dollar. Treasury yields fell sharply on the news and the dollar got hit hard yesterday across major pairs and gold. Market moves could be uncertain given that today is Thanksgiving public holiday in the US and US bond markets are closed, meaning lighter trading volumes are likely across markets. This could make for a quiet day but also potentially unpredictable swings. Early moves seem to be uninspired, but it could still be a day for caution.

Wall Street corrected back yesterday as it edged away from recent all-time highs, with the S&P 500 -0.1% at 2597. Asian markets were mixed with the Nikkei +0.5%, however European markets are more cautious, with very slight weakness in early moves. After yesterday’s late surge of dollar selling, the forex markets are relatively settled so far today, with very little move on any major pair. In commodities, gold has unwound just a touch following yesterday’s strong gains, whilst oil is consolidating yesterday’s upside push.
With the US on Thanksgiving holiday today there could be a quiet feel to trading today. The economic data from Europe could play a role though in guiding markets with the flash PMIs for the Eurozone at 0900GMT. Eurozone Flash Manufacturing PMI is expected to slip slightly to 58.3 (from 58.5) whilst Eurozone Flash Services PMI is expected to tick mildly higher to 55.3 (from 55.0). The second reading of UK Q3 GDP is at 0930GMT and is expected to be confirmed at +0.4% which was the prelim reading.
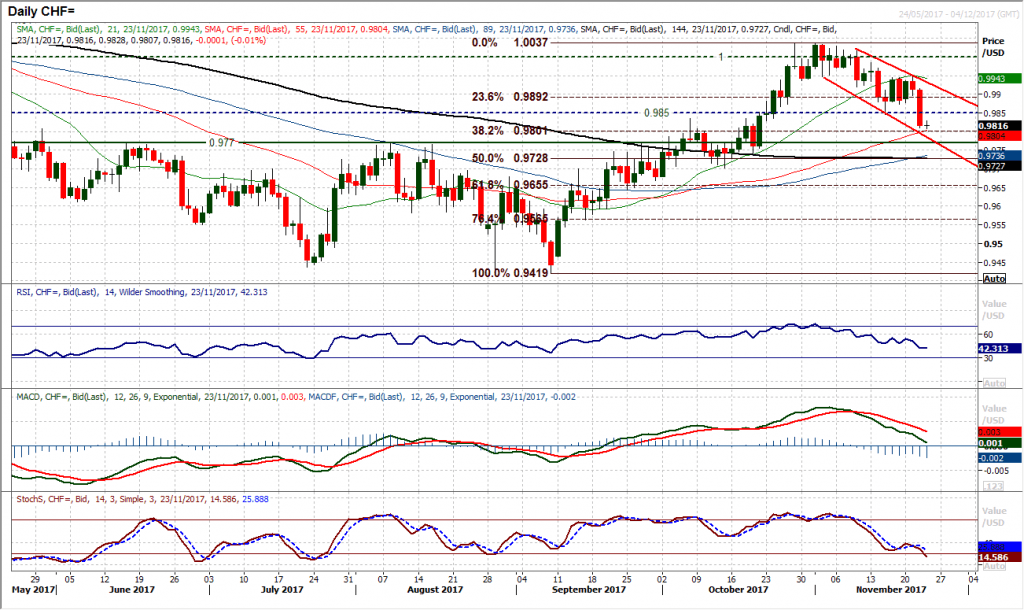
Chart of the Day – USD/CHF
There seemed to be a real move against the dollar yesterday, with the safer haven major currencies really performing strongly. With the yen very strong, the Swissy also gained significant ground against the dollar. This culminated in a very strong bearish candle that moved to a four week low and accentuated what now seems to be a corrective trend on USD/CHF. The momentum indicators confirm the correction with the RSI falling at a 10 week low, whilst the Stochastics have just crossed lower again. Rallies are now certainly a chance to sell within the growing downtrend which comes in today at 0.9930. The decisive breach of the support at 0.9850 is a move below a longer term pivot and now open a likely retreat towards the key support at 0.9770. The 38.2% Fibonacci retracement of the September/October rally comes in at 0.9800 and is the initial test. However with the acceleration lower of momentum indicators look to use intraday strength to sell. The hourly chart shows a near term “sell zone” between 0.9845/0.9875 for any unwinding moves today.
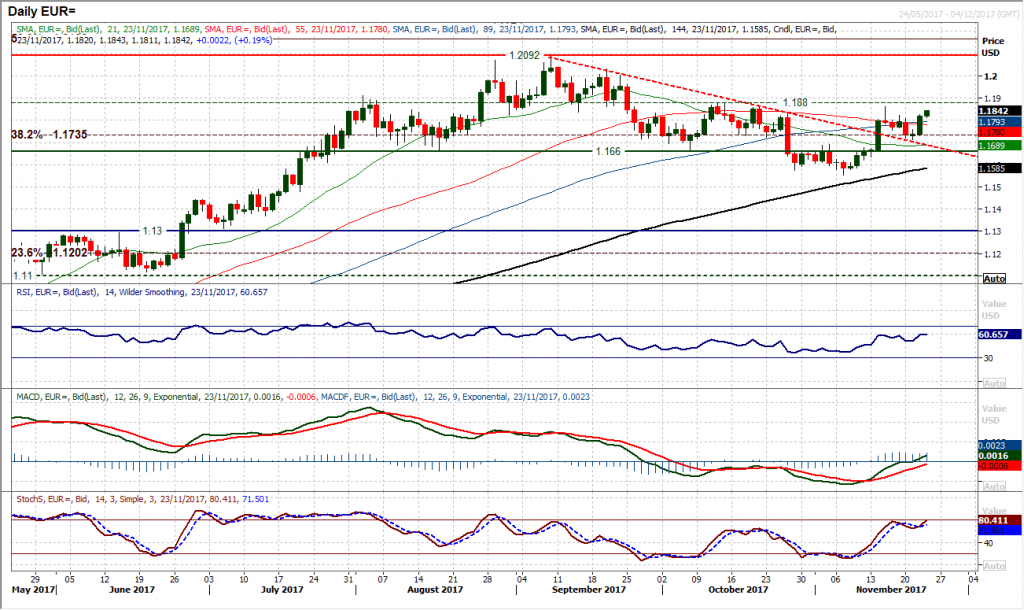
The strong positive candle posted yesterday reflects a bolstering of the support from the recent low at $1.1720. The move has also helped to improve the configuration on the momentum indicators once more with the RSI pushing towards 60, MACD lines on the brink of rising above neutral and Stochastics edging higher again. This reflects a positive bias within what I still consider a medium term “neutral zone” of trading above the support band $1.1660 (neckline)/$1.1730 (old lows) but below the $1.1880 right hand shoulder resistance. The weakness of the dollar has been the main driver of this move and has continued into today’s session. The hourly chart shows a move above $1.1820 initial resistance has opened $1.1860 and that near term corrections are a chance to buy now for the test of $1.1880. There is a basis of support between $1.1760/$1.1810 now.
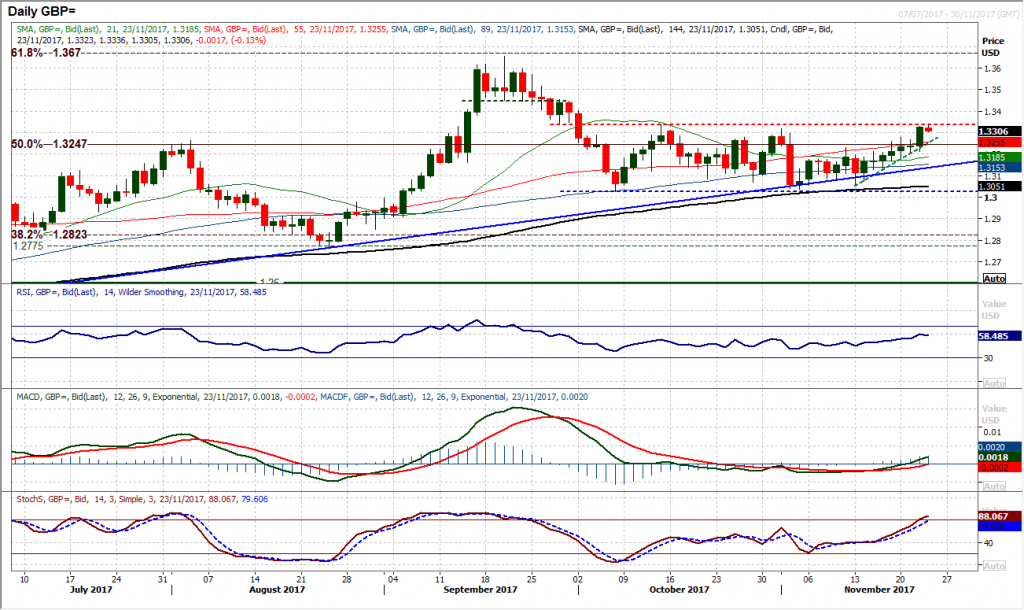
Is Cable now set to breakout to the upside of the medium term, seven week range? Yesterday’s strong bull candle would have you think so. Adding just under 90 pips on the day the buyers have pulled the market towards the key range high at $1.13335. The move has driven what looks to be a tentative thumbs up from the momentum indicators, with the RSI above 60 for the first time since late September and the MACD lines beginning to rise above neutral. The market looks a touch tentative today but it will be interesting to see how the European traders react this morning, given the US public holiday for Thanksgiving. The hourly chart shows strong momentum configuration but stretched and how the buyers react to a minor intraday unwinding move (if one were to be seen) could be key to whether we see a breakout. A close above $1.3335 would be a decisive medium term breakout and continue the upside potentially towards the key September high of $1.3655. Near term support is at $1.3280 with $1.3210 now key.
USD/JPY
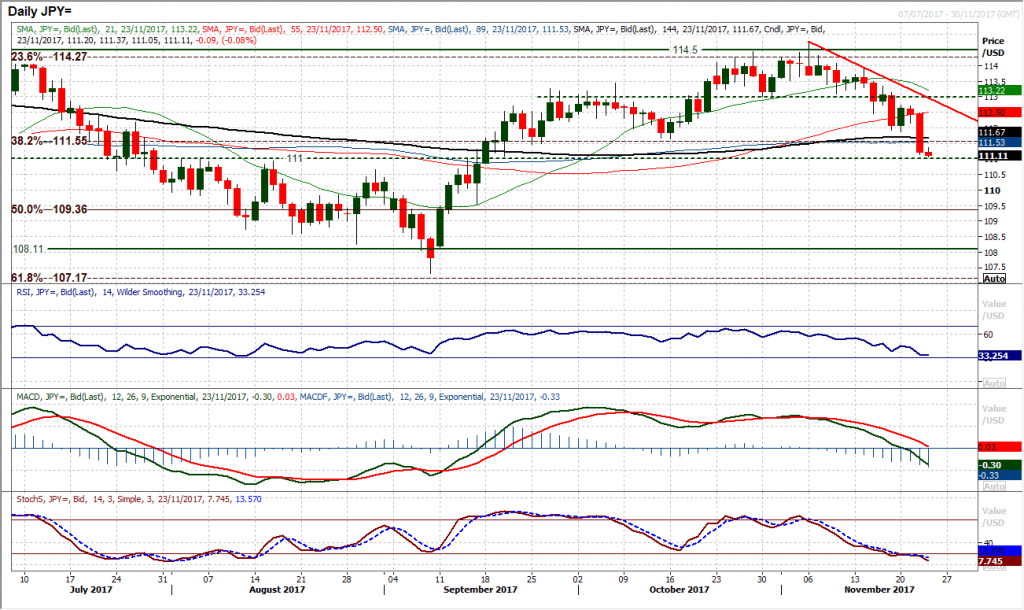
The accelerating downtrend and increasing magnitude of the bear candles all mount to reflect the bearish near term control within the medium term trading range. The market dropped 115 pips yesterday with the strongest bear candle since the 17th May. The breach of the 111.45/111.65 support band is a decisive move too for the bears, taking the market below all the moving averages and to a two month low. The deterioration in the daily momentum indicators continues, with the RSI falling in the mid-30s and MACD lines strongly lower ready to move below neutral. The long term pivot of 111.00 will be the next test as support now, as a breach would open the next basis of support around 109.50. Lower highs and lower lows means that rallies remain a chance to sell, with initial resistance at 111.87 for any unwinding move.
Gold
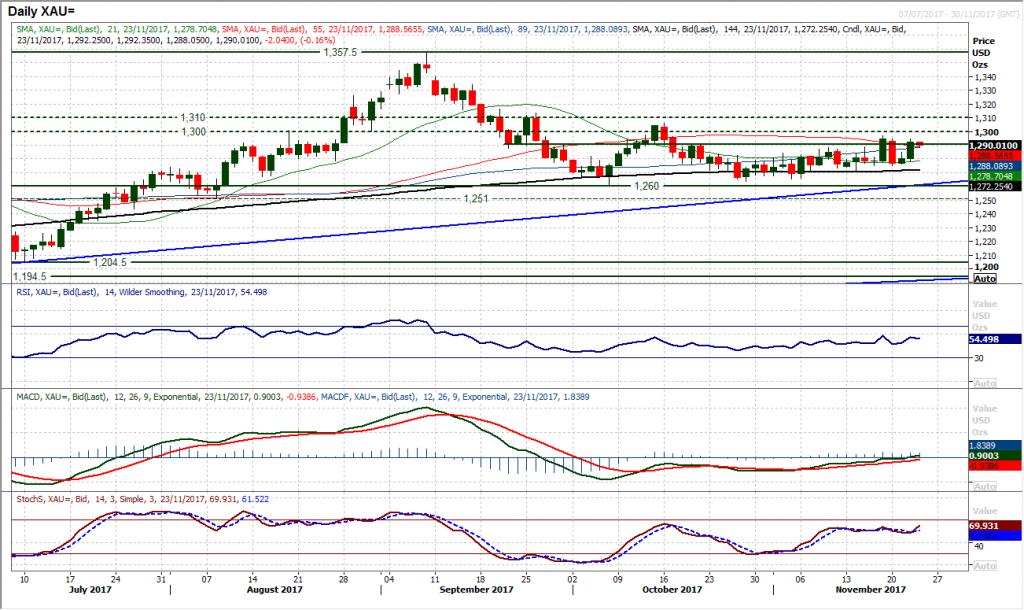
Is gold setting up for a breakout above the long term pivot band $1300/$1310? The market posted another strong bull candle yesterday to put pressure on the underside of this band once more. There has been a sequence of higher lows during the past few weeks and the market has been edging higher. However previous form within recent trading has seen attempted bullish moves quickly snuffed out. That makes trading in the coming days important. It could be difficult though, with Thanksgiving in the US, but initial resistance at $1297 could now come under pressure and a break above $1297 today would validate yesterday’s strength. The hourly chart shows an initial unwinding drift today but the $1288/$1289 near term support is holding. The main band of near term support is now between $1275/$1284.
WTI Oil
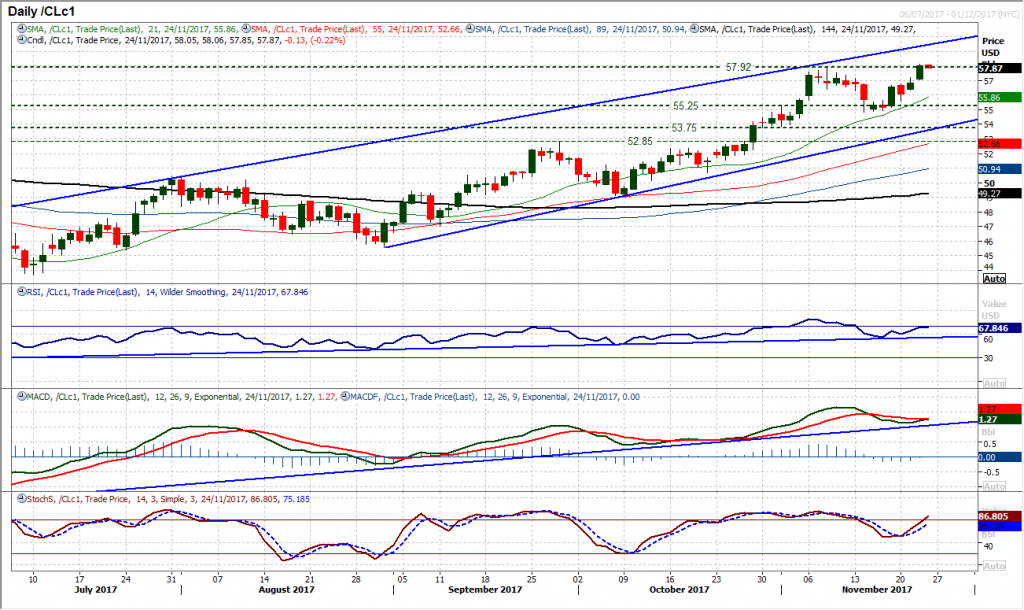
A mixed set of EIA inventories have done little to derail the recent rally, with slight intraday declines seen to be supported once more at higher levels. The focus is far more on the OPEC meeting too if anything. The bulls broke to a two year high yesterday morning and a positive response to intraday weakness saw the market closing with a breakout. The unwind was seen as a near term chance to buy with daily momentum indicators still strongly configured on a medium term basis. There is a basis of support on the hourly chart between $56.35/$56.75 but $57.33 is now an initial support. There is now minor resistance at yesterday’s high at $58.15 but little real resistance before the round number $60 and a key 2015 resistance around $61.50.
Dow Jones Industrial Average
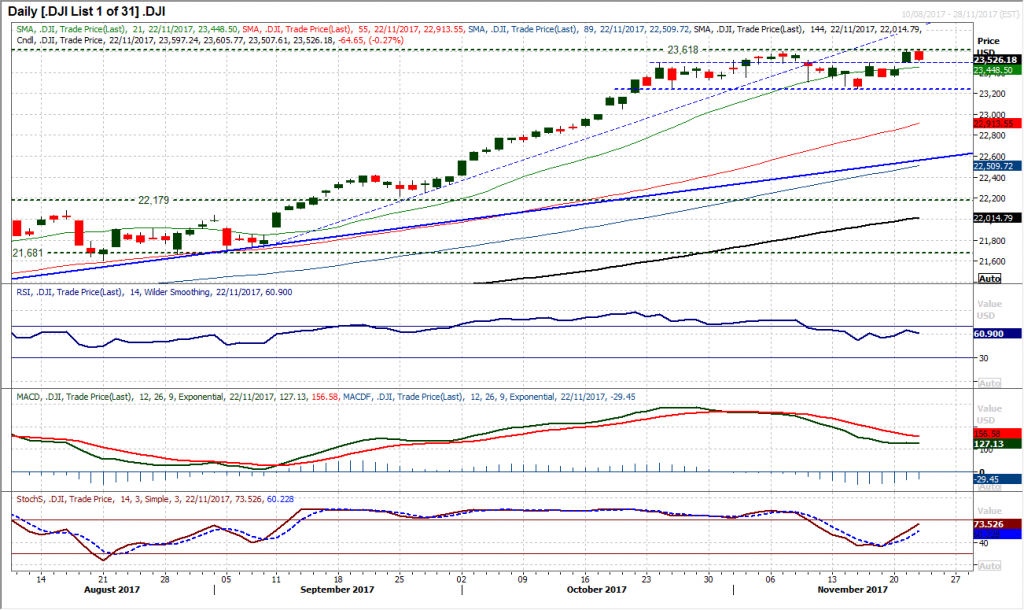
After such a strong move higher in the previous session the Dow lost a bit of ground yesterday. Without the closing breakout above 23,602, there is the possibility that this is still a range play and we will know reasonably soon whether the bulls are prepared to move for a breakout. The pivot within the range comes in at 23,485 and this will gauge whether this move is the bulls unwinding for the upside break or whether this is a correction within the range. The hourly indicators are unwinding but if the hourly RSI holds above 40/50 and the MACD lines hold above neutral this would be a positive move to help renew upside potential. A closing breakout above 23,602 implies around 350 ticks of upside, but for now we wait to see if this is the case. The market is closed today for Thanksgiving.
Author

Richard Perry
Independent Analyst


