Dollar remains strong after hawkish lean from FOMC’s Evans
Market Overview
Trading sentiment remains reasonably stable in spite of the US dollar continuing to creep higher. Support has come from a suggestion from one of the FOMC’s historically more dovish members, Charles Evans, that there may be three rate hikes by the end of next year if inflation and labor market trends continue. The move was also boosted by a one year high in the Markit Flash Manufacturing data. This all is helping to lift Treasury yields higher and means that a prospective rally on gold is being stunted. Positive corporate earnings are helping to support Wall Street which could have been coming under pressure from the prospect of higher US interest rates. However, with the oil price rally now being questioned, this also has the potential to be a drag on equities. Suggestions that Iraq is looking to not take part in the OPEC production cuts has the potential to escalate within the organisation and the risk would be that is threatens to derail the agreement that has pulled prices higher in recent weeks.

Wall Street closed 0.5% higher on the S&P 500, whilst Asian markets were also positive with the Nikkei +0.8% and European markets are following a similar pattern, although the FTSE 100 is again lagging slightly on the sterling support and oil price dip. Forex markets show the dollar strength again peaking through, whilst it is interesting that the Aussie and Kiwi are marginal outperformers. Gold and silver are trading marginally higher in early moves whilst oil is mixed.
Traders will be looking out for the German Ifo Business Climate at 0900BST which is expected to stay at 109.5. For the US data today there is the S&P Case Shiller Home Prices Index at 1400BST which is expected to stay at 5.0%. The at 1500BST there is the Conference Board’s Consumer Confidence which is expected to drop back from last month’s very strong 104.1 to 101.0. The Richmond Fed’s Manufacturing Index is also at 1500BST and is expected to improve marginally to -5 (from -8). There will also be speeches today from Bank of England Governor Mark Carney (at 1535BST) and the ECB President Mario Draghi (at 1630BST).
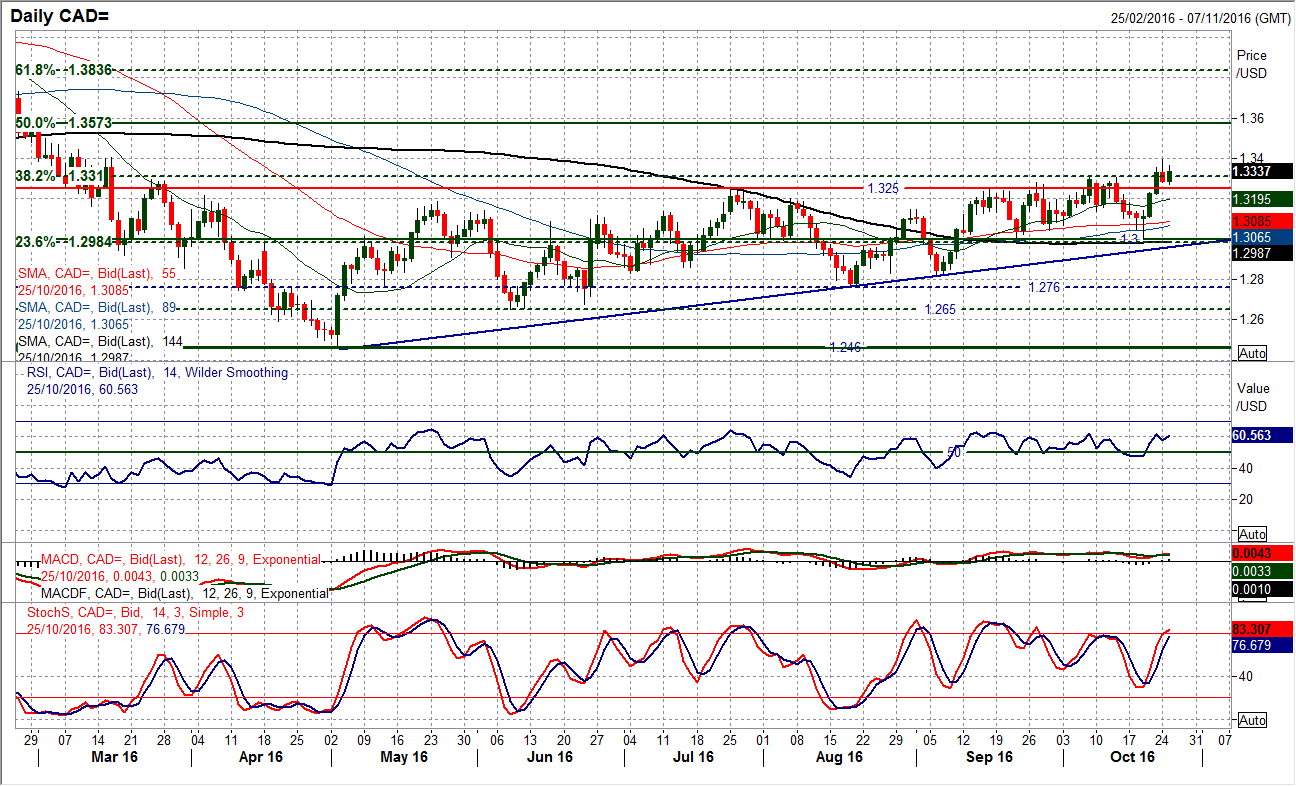
Chart of the Day – USD/CAD
The turnaround in the outlook for the pair in the wake of the Bank of Canada monetary policy decision has been huge. The Loonie went into the BoC meeting last week on the front foot however news suggesting that officials “actively” discussed the possibility of more stimulus has seen traders selling the Canadian dollar. There has subsequently been a significant rebound from the low at 1.3002 which has taken the pair all the way through key resistance in the band 1.3250/1.3310. Although a two day closing breakout just failed on a dip into the close last night, the bulls are still fighting hard to hold on to the improvement. This move to a new high dating back to March effectively completes a base pattern that would imply a move towards 1.3740 in the coming months. The daily RSI momentum would ideally be stronger and pushing towards the high 60s and towards 70 in the coming days to help confirm the move. However traders will now be looking to use corrections as a chance to buy, with this old band of resistance between 1.3250/1.3310 now as a basis of support for a pullback. Initial support is the overnight low at 1.3275 is now the initial support. The next resistance is at 1.3400/1.3445 and the 50% Fibonacci retracement of the 1.4689/1.2458 sell-off at 1.3573.
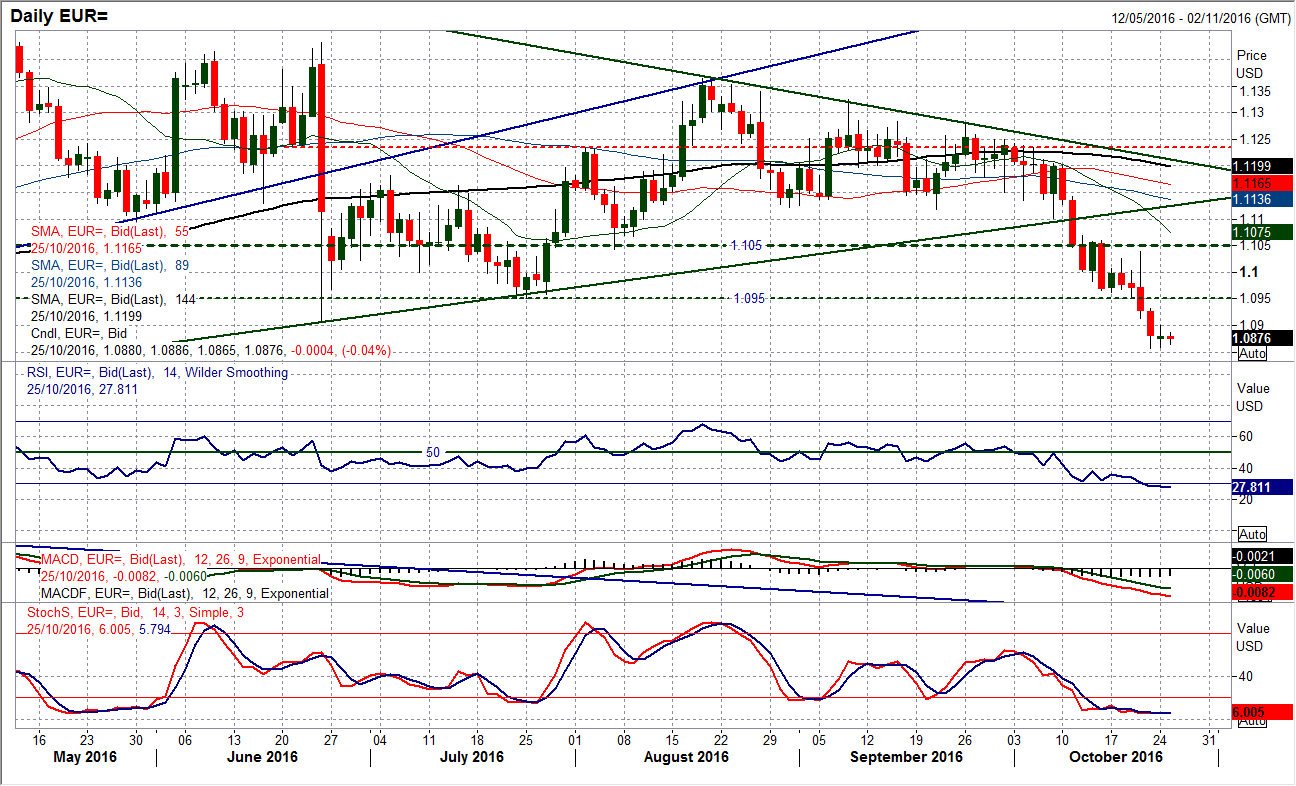
The market showed the first sign of real support yesterday after the big sell-off of the past week. A doji candle (open and close around the same level) with the support at $1.0857 holding firm means that for the time being, the selling pressure has abated. The market is again supported today and moving into the European session a similar picture is emerging. The downside momentum on the RSI seems to have been calmed and with the RSI now just below 30 (a level that is extreme by EUR/USD standards) this, coupled with the support holding, increases the potential for a recovery rally near term. The hourly chart shows the initial resistance is at $1.0900 and it will be interesting to see if the hourly RSI starts to push above 60. If the hourly MACD lines start to also push above neutral this would also be a suggestion that the momentum is building for a near term bounce. There is key resistance overhead at $1.0950 and is likely to be limiting to a rally before the sellers return.
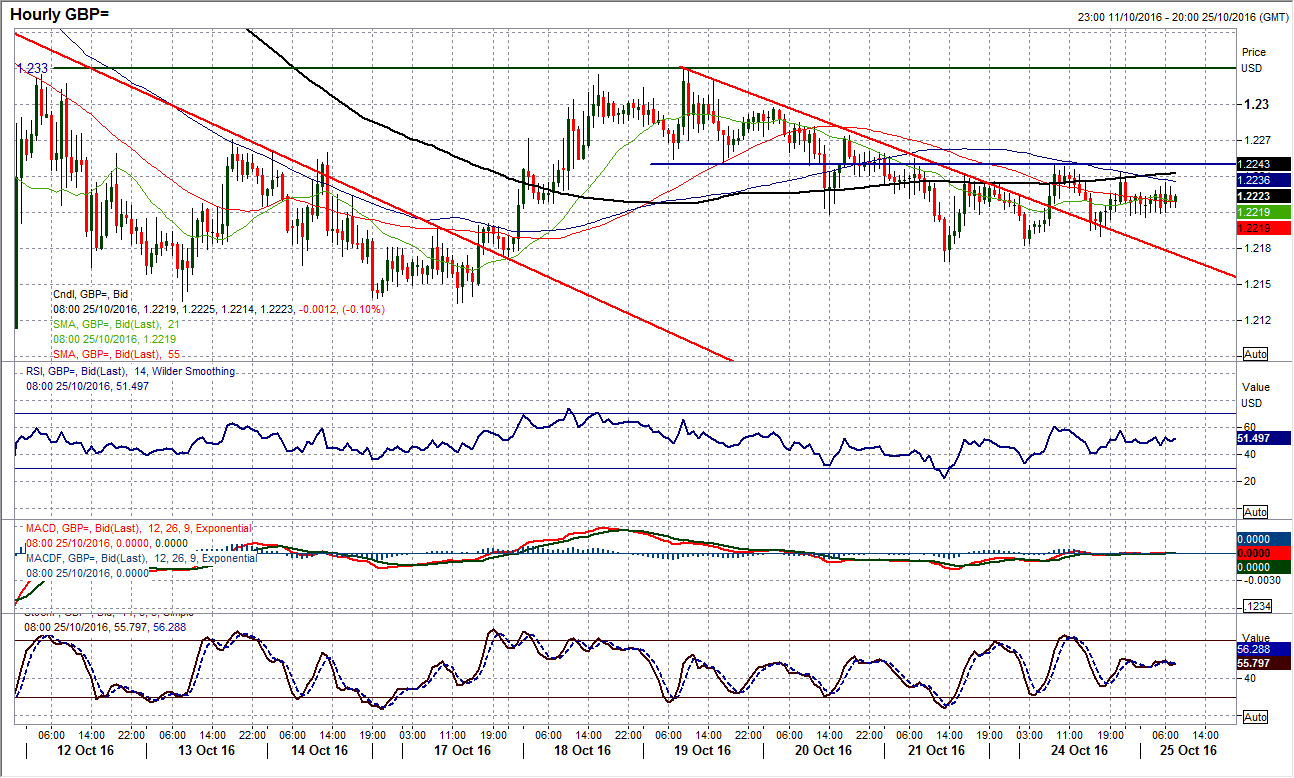
The daily chart shows that the sequence of corrective candles within the range has been broken and the market appears to once more be settling down. The tight, small bodied candles of the past week reflects a lack of conviction in the selling (especially compared to just a few weeks ago). Momentum indicators are plateauing with the RSI flattening around 30 and the MACD lines bottoming. The suggestion is that this is part of a consolidation process and means that we must look towards the extremes of support and resistance for the trigger. That means the support at $1.2086 bolstered by $1.2130 is key, whilst the resistance at $1.2330 is also crucial for the near term outlook. If this is the case then Cable is bang in the middle of the range. The hourly chart shows the little downtrend has been broken and hourly momentum I increasingly neutral (hourly RSI now settling between 40/60, hourly MACD lines flat). There are tighter levels to watch at $1.2180 and $1.2250 that could drive some direction near term but for now Cable is increasingly directionless.
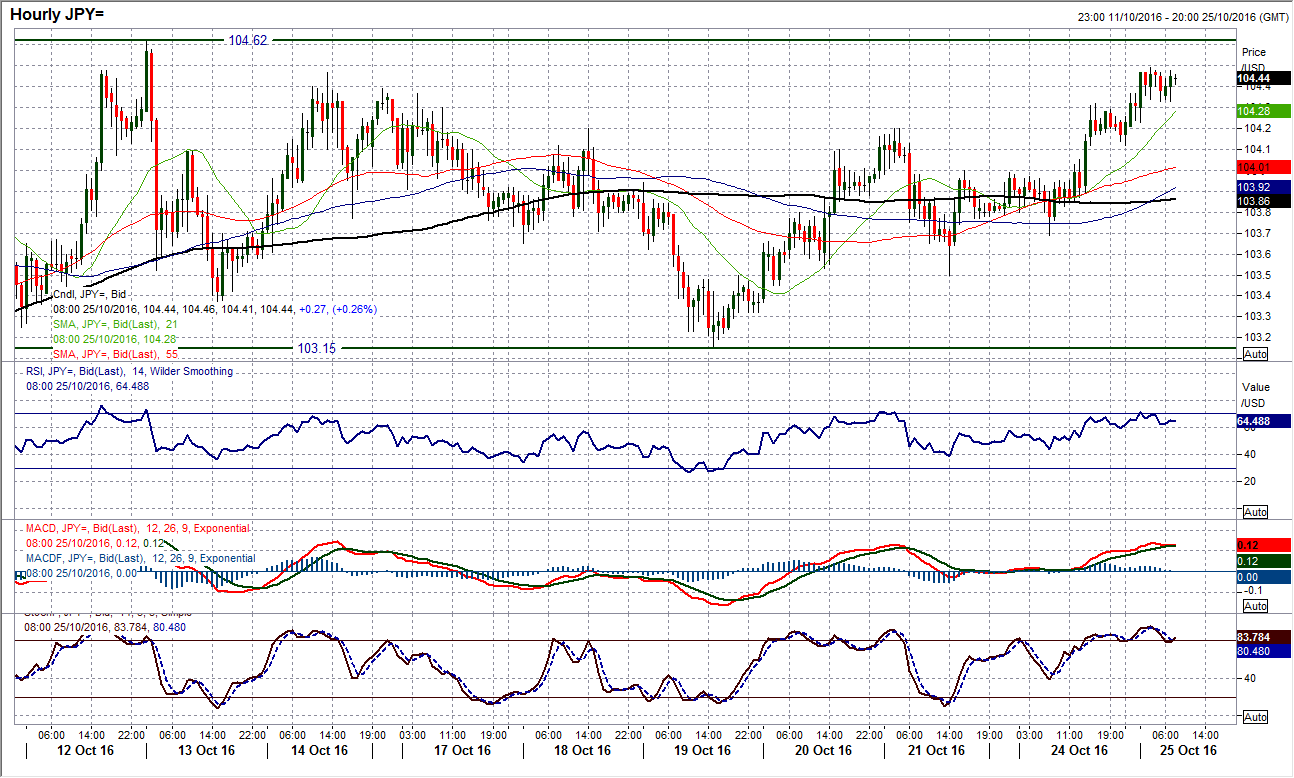
USD/JPY
Having developed a consolidation pattern, the dollar has started to find a little more direction in the past 24 hours and the bulls will be eying the key resistance once more. Although a close above 104.30 is still yet to be seen, yesterday’s positive candle is being followed up by further gains today. The market has now posted higher lows in each of the past three sessions and pressure is mounting once more on the intraday high at 104.62. The daily momentum indicators are beginning to tick higher again with the RSI back above 60 and the Stochastics also halting their corrective slant. Can the bulls breakout this time? The hourly indicators are now at levels at which if this is a continuation of the range play, it will induce another corrective move. The market has dropped back from 104.50 whilst there is support of a minor reaction low at 104.12. An intraday move above 104.62 and/or a close above 104.30 would really suggest the bulls were back in control for a move towards 105.50 and beyond. There is now near term support in the 104.00/104.20 range.
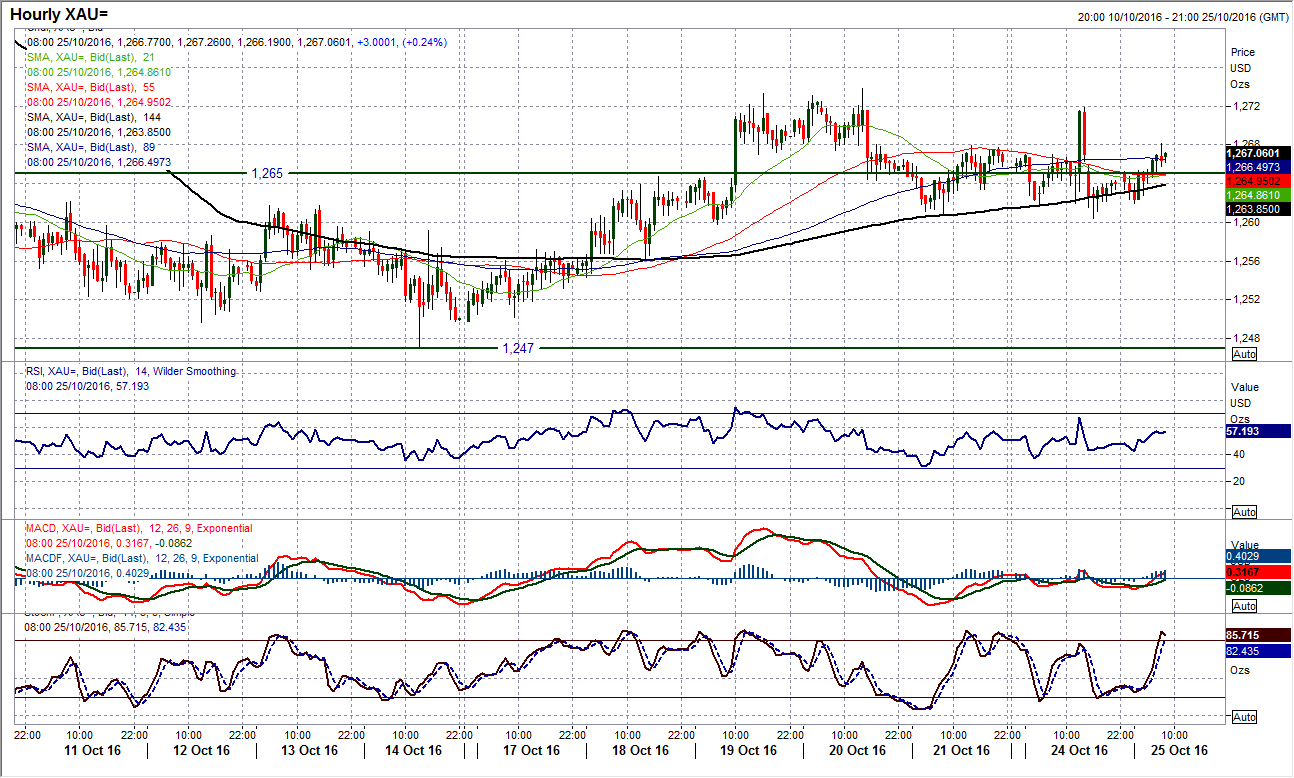
Gold
The consolidation on gold continues. The break above $1265 last week seemed to suggest the bulls were ready grasp control of the situation but a series of neutral and somewhat disappointing candles show the market is struggling. However the momentum indicators are still improving, with the Stochastics really rising whilst the MACD lines are pulling higher. The market is now consolidating and using a band of support between $1260/$1265 as the basis for near term lows now. The hourly chart shows that this consolidation is resulting in a lack of direction on the momentum and moving averages which also suggest perhaps a catalyst may be needed now. A move below $1260 would question the positive basing recovery outlook and a breach of $1256 would confirm the end and the continuation of what would be a range above $1241.
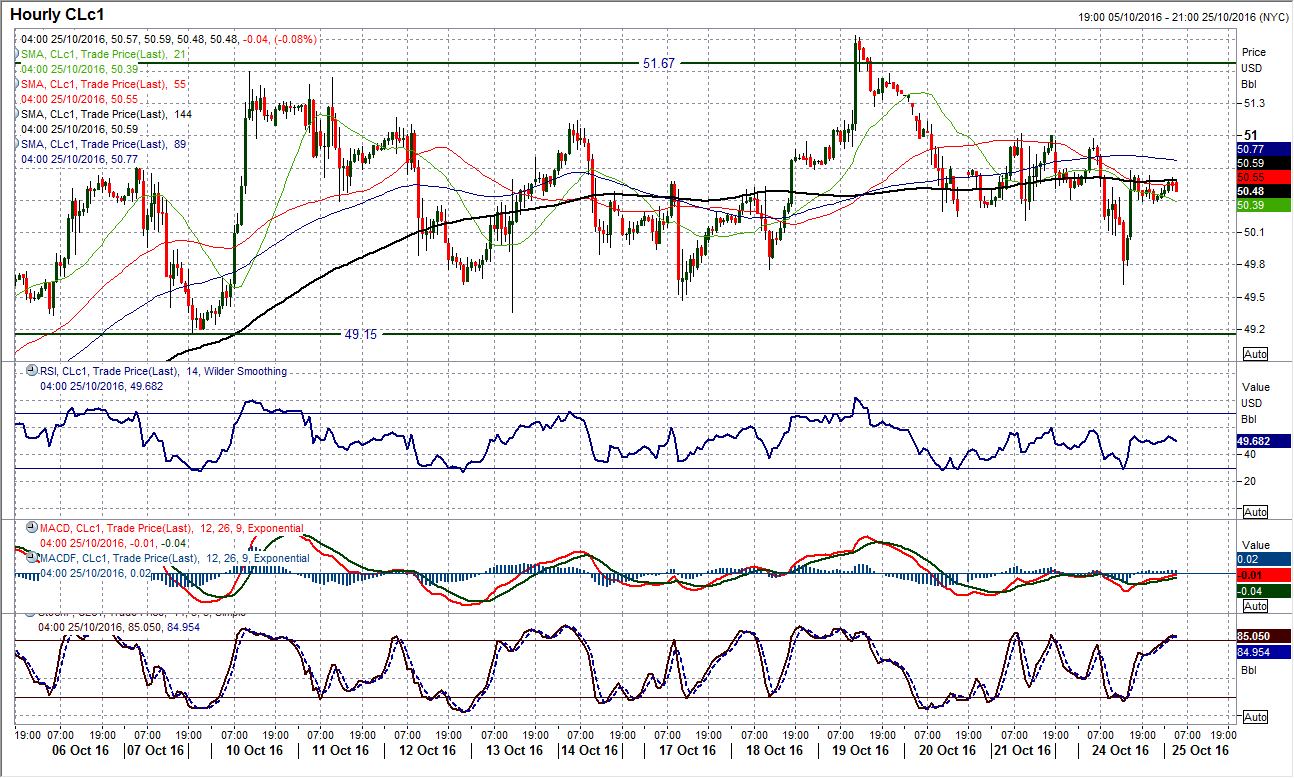
WTI Oil
The momentum in the bull run higher is being seriously questioned now after another bear candle. The market had been posting higher lows over the past few weeks but the pressure on a correction is growing. The key support is at $49.15 but the deterioration in the momentum indicators suggests that this support could now be tested. The RSI is now falling to a 4 week low, whilst the acceleration in the Stochastics decline is becoming a significant concern. The hourly chart had spent almost two whole sessions consolidating between $50.20/$51.00 but the downside break means now that the key reaction low at $49.35 could be tested now. $51.00 now becomes a key lower high. For now though this remains a range play but the bulls will be increasingly concerned.
Author

Richard Perry
Independent Analyst


