Dollar recovery hitting sentiment on forex, gold and oil

Market Overview
There has been a change in sentiment early this week as the embattled US dollar seems to be engaging in a near term recovery. Last week’s precipitous sell-off seems to have been a blow-out which took the market a little too far too fast and now a retracement is underway. One of the drivers has been a notable acceleration higher in bond yields. The US 10 year Treasury yield has risen above 2.70% and is now closing in quickly on 2.80% to 3.00% which are the next key levels where Treasurys may find some solace. The Atlanta Fed suggesting in its first reading of its GDPNow at +4.2% for Q1 growth has certainly helped the move. However the speed of yields rising has just begun to register on Wall Street and made equity traders a little jittery. If the acceleration higher on yields continues then there could be some more selling pressure similar to yesterday’s decline on Wall Street which saw the biggest falls of 2018 (although such has been the rise of markets in recent weeks, this is not saying a lot). The dollar rebound is though impacting across major markets, with the bull markets in commodities also beginning to wane. This all comes ahead of the Fed and Non-farm Payrolls later in the week, whilst another stellar consumer confidence number today could add fuel to the fire.

Wall Street dropped broadly last night, with the S&P 500 -0.7% at 2853, whilst Asian markets were also under pressure (Nikkei -1.4%) and European markets are similarly feeling the pain in early moves. In forex there is a decisive risk off feel, with the dollar rallying across the majors with one notable exception being the outperformance of the yen. In commodities the stronger dollar is also hitting gold again, whilst oil is also lower.
Traders will be looking out for Eurozone flash GDP at 1000GMT today with the expectation that there will be +0.6% for the QoQ data (+0.6% in Q3) but that would mean the YoY read improving to +2.7% (from +2.5% in Q3). Also watch out for the German flash inflation at 1300GMT which is expected to remain at +1.60%. The Case Shiller Home Prices Index is at 1400GMT and is expected to remain at +6.4% for the year. US Consumer Confidence is at 1500GMT and is expected to pick up again to 123.0 (from 122.1) which remains an incredibly strong number.
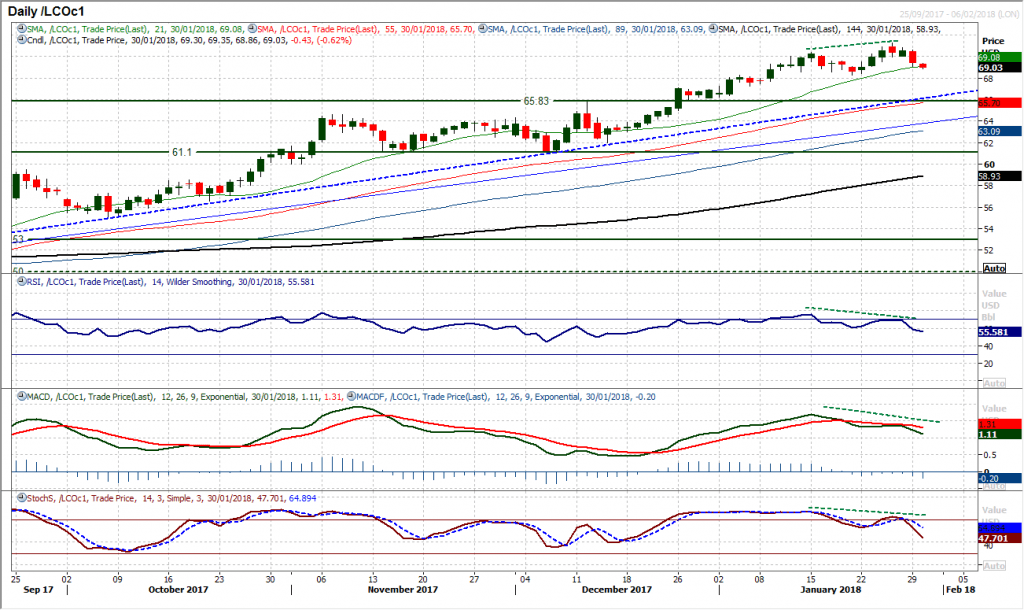
Chart of the Day – Brent Crude
The outlook for the two oil prices tends to be reasonably similar, however in recent days there is a technical deterioration in Brent Crude that could lead to a similar move developing on WTI. There is a series of sell signals across Brent Crude now on a near to medium term basis which should act as a warning signal. On Brent Crude the market reversed from a multi-year high of $71.28 last week, however the higher high on the price was not matched with that of momentum indicators. Negative divergences were seen on all the RSI, MACD and Stochastics. The RSI has now completed a “failure swing”, with a “bear kiss” on the MACD lines. This comes with yesterday’s negative candle that has taken the market back below $70 again. The support of the reaction low at $68.30 is now key. The hourly chart shows the configuration turning far more corrective on the RSI and MACD lines, whilst the market is now below the near term pivot support at $69.60 which in turn becomes resistance today. Another lower high between $69.60/$70.20 would increase the corrective pressure now.
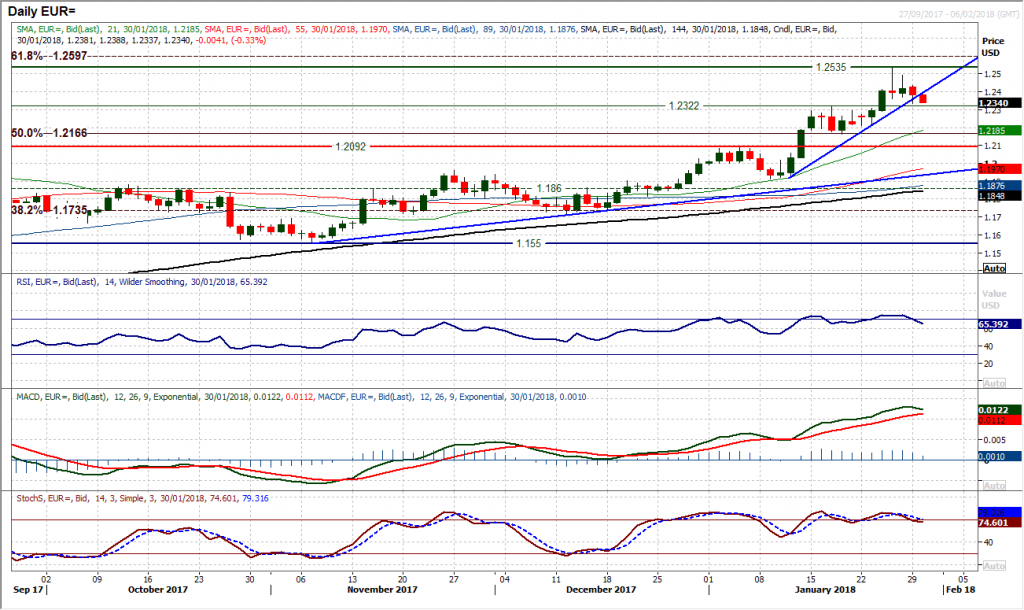
EUR/USD
The market continues to threaten to top out as a series of corrective candles begins to build up and a two week uptrend has now been broken. The market has been choppy in recent sessions but losing the support at $1.2360 during yesterday’s session seems to be driving some near term direction now as the market is lower again in early moves today. The momentum indicators have lost their impetus for the rally but at this stage nothing is yet confirmed and this could still be playing out as part of a consolidation. There are no sell signals yet on the daily chart to go on. The support of the breakout at $1.2320 will be seen as a key level on a closing basis as a breach would begin to drag the market back towards the $1.2090/$1.2165 support band. The hourly hart shows a near term resistance band $1.2360/$1.2390, with the momentum indicators turning more corrective. For now this is more of a drift lower rather than decisive selling and as such conviction in the move is not high.
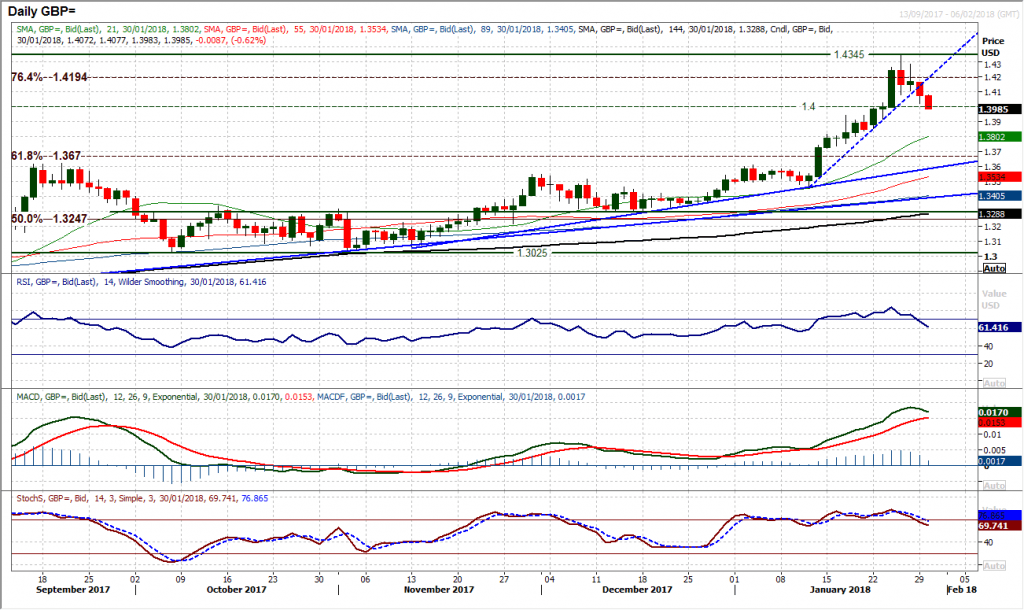
GBP/USD
Compared with EUR/USD, the corrective forces running through Cable are far more pronounced and decisive now. The negative candles of recent days come with far more magnitude, whilst the signals on the momentum are more considered. There is now a run of negative candles forming, with another 95 pips of downside yesterday and continued losses today. The RSI has crossed below 70 for the first time in two weeks for a sell signal, whilst the Stochastics are also now crossing for a sell signal. The support at $1.4000 is more psychological but is now being tested, but aside from minor support at $1.3945 there is little real support until $1.3650 now. The hourly chart shows a small top pattern having formed which gives a 200 pip downside target from $1.4080. Intraday rallies are now being sold into, with $1.4080 being a basis of resistance now.
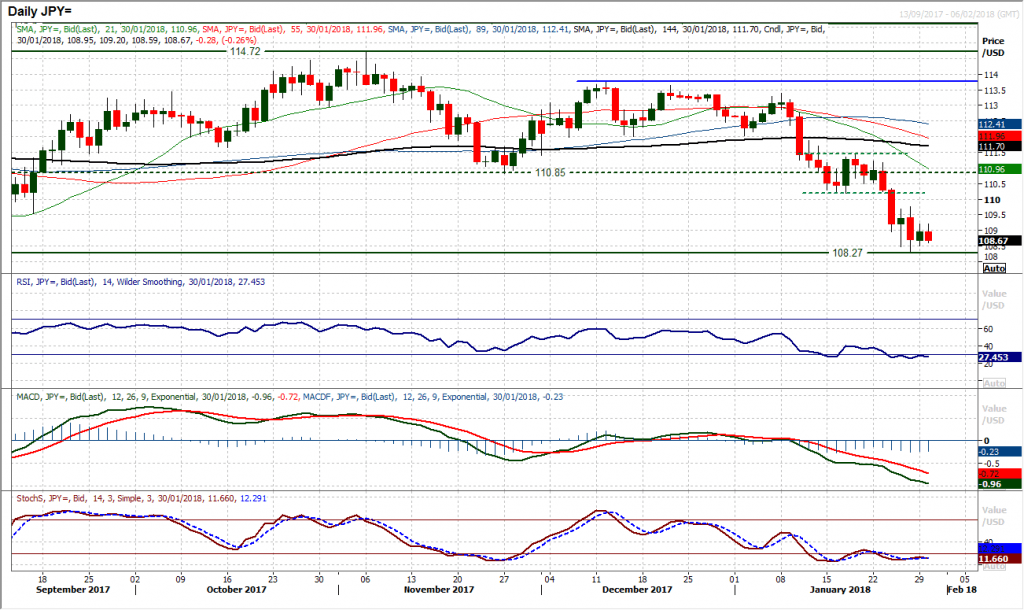
USD/JPY
The dollar may be in recovery mode across several of the forex major pairs, but against the yen it is still struggling for traction. The positive candle formed yesterday has been entirely retraced early today as the selling seems to have not quite finished. This comes with little real sign of an impending recovery on the daily chart, with all momentum indicators remaining negatively configured. The hourly chart shows how momentum indicators are struggling still with the hourly RSI failing around 60 and MACD lines failing around neutral. There is now resistance at 109.20 which is an initial barrier but the main near term resistance is at 109.75. A break above 109.75 would complete a small base pattern but for now the bulls continue to struggle for traction. A move below yesterday’s support at 108.50 would re-open the recent low at 108.27, with the September low at 107.30 still possible.
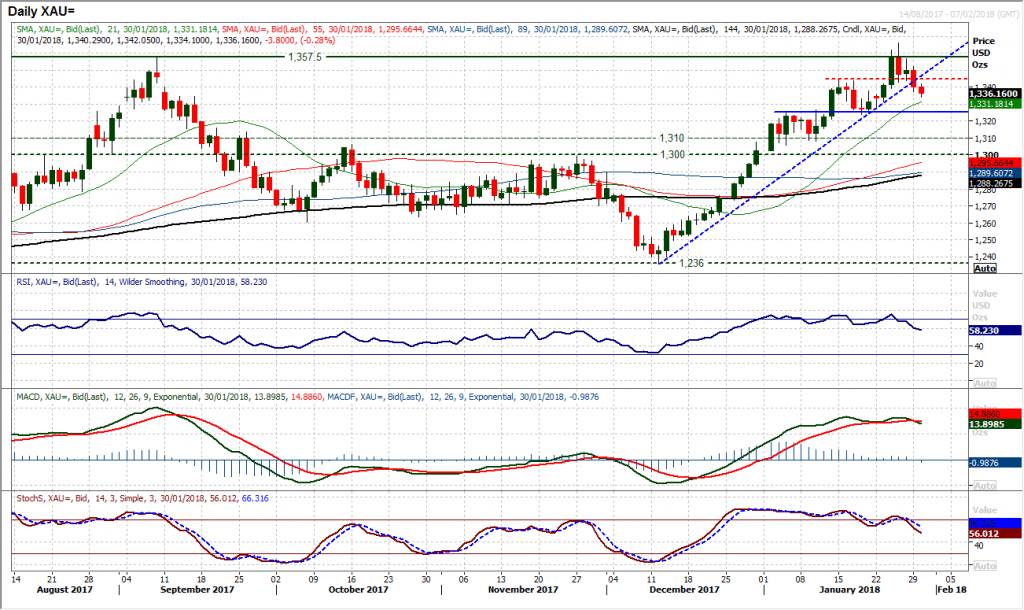
Gold
The near term corrective signals are racking up now. With the support at $1244 having been breached, the seven week uptrend has also been broken, whilst there is a range of near term momentum sell signals. The RSI is falling at a five week low, whilst the MACD lines have bear crossed as have the Stochastics. The negative candles are also building up. Having broken the support at $1244 the market is now on the retreat to the next breakout support at $1224 from the mid-January low. The market is now consistently posting lower highs on the daily candles and on the hourly chart it is interesting to see the old support at $1344 now turning into resistance as intraday rallies are being sold into. A breach of $1324 would open the long term $1300/$1310 pivot support band.
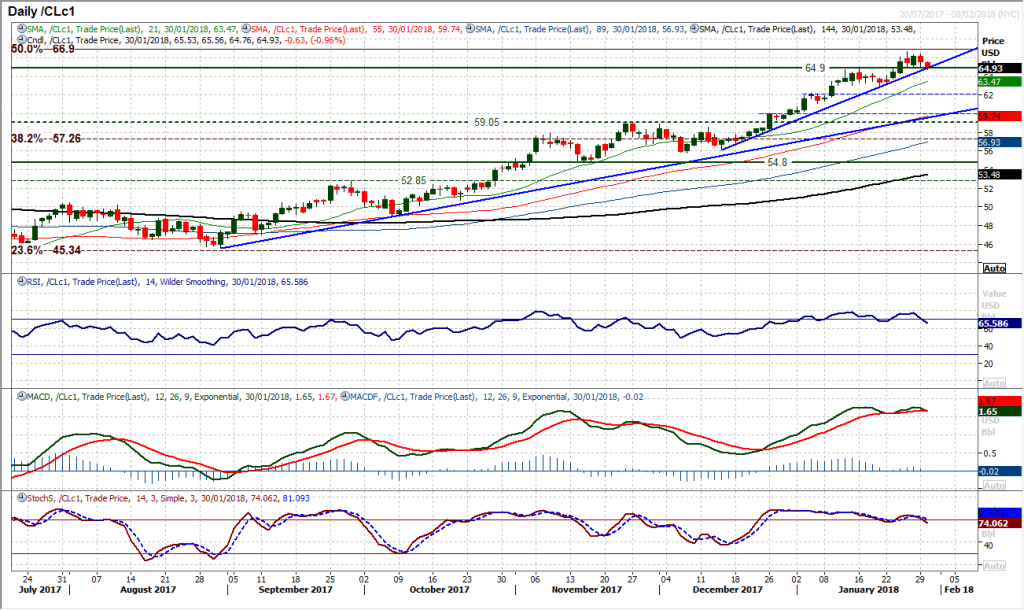
WTI Oil
A dollar recovery would begin to increase potential for profit-taking on oil and the negative candle formation seen yesterday as the dollar ticked higher would back that view. However the outlook for WTI has not rolled over quite yet with the breakout support initially at $64.90 which is also coinciding with the 6 week uptrend support today. However, the warning signals are there, and a closing breach of $64.90 constituting a breakdown. Furthermore, the momentum indicators which have lost their bullish intent in recent days. If the RSI begins to close consistently below 70, as the MACD lines cross lower and the Stochastics also give a sell signal, then the bears will begin to gain the ascendency. The key support near term is at $62.85 which is the first key reaction low within the uptrend and a breach would signal a change of trend. The hourly chart shows a band of support $64.40/$64.85 initially protecting from a correction.
Dow Jones Industrial Average
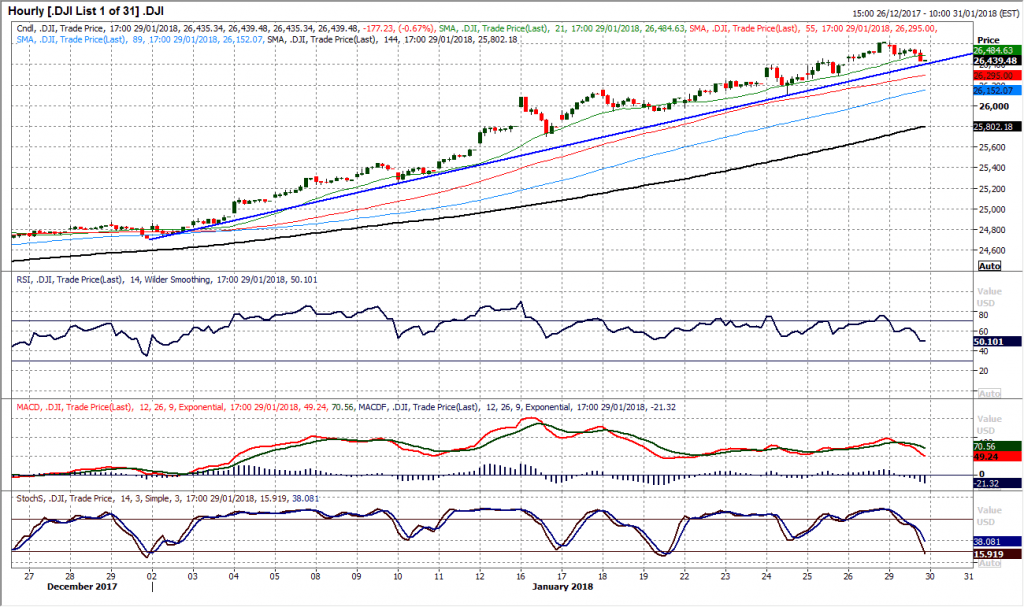
Corrections remain a chance to buy on the Dow and although yesterday’s session of -177 ticks may seem a lot, in the context of what has been seen previously on the upside on the Dow, there needs to be a lot more significant selling pressure to suggest that the bulls have lost control. The support of the now four week uptrend comes in at 26,400 today and should help to bolster any near term weakness. The daily momentum indicators are also still showing very little by way of corrective signals, other than a drop on the RSI to 78, so for now there is very little reason to think that this move will not be another buying opportunity within the uptrend. The hourly chart is a touch more concerning with the rising 21 hour moving average at 26,485 which has been a basis of support throughout January, now having been broken. Watch the hourly RSI too, which has continually bottomed throughout this month around 50. Any continuation of the hourly RSI lower would be a warning for the bulls. Initial support at 26,425 and then the low at 26,313. Resistance is now in place at the all-time high of 26,617.
Author

Richard Perry
Independent Analyst


