Dollar making gains as Treasury yields break out

Market Overview
As Treasury yields continue to breakout there has been a key shift in sentiment seen on the dollar. The question that traders will be asking themselves is whether this move on yields will be sustainable, and hence whether the dollar can continue to climb. The move on the US 10 year yield is now the highest since January 2014 having broken above 2.95%.It is now within sniffing distance of the psychological 3%. The Dollar Index is now back to test 90.5 resistance, levels of late March into April, but also testing the resistance of a 13 month downtrend. This dollar strengthening is showing across the forex major pairs (see the analysis below), whilst the sharp rise in bond yields is creating nervousness in equity markets, with Wall Street slipping for the past three sessions and now threatening the recovery of recent weeks. The early moves today are cautious on forex and equities, but if yields continue to climb then the dollar strength and equities lower direction of recent days could continue.

Wall Street close weaker with the S&P 500 -0.8% at 2670 but Wall Street futures are stable in early moves today. Asian markets were slightly lower (Nikkei -0.3%) but European markets are looking to form some support in early moves. In forex, there is a slip on the euro and continued weakness on the yen, but sterling is performing better after the recent sharp decline. In commodities, the dollar strength is still pulling gold weaker, whilst oil is also marginally lower.
The flash PMIs will garner attention for traders today. With economic data in the Eurozone deteriorating in recent weeks, the flash Eurozone Manufacturing PMI at 0900BST is expected to dip to 56.1 (from 56.6) whilst flash Eurozone Services PMI is expected to slip to 54.6 (from a downwardly revised 54.9 whilst the flash Eurozone Composite PMI is expected to be 54.9. In the afternoon the flash US Manufacturing PMI at 1445BST is expected to slip to 55.3 (from 55.6) whilst the flash US Services PMI is expected to improve to 54.3 (from 54.1). The US Existing Home Sales at 1500BST is expected to improve by +0.2% to 5.55m (from 5.54m)
Chart of the Day – GBP/JPY
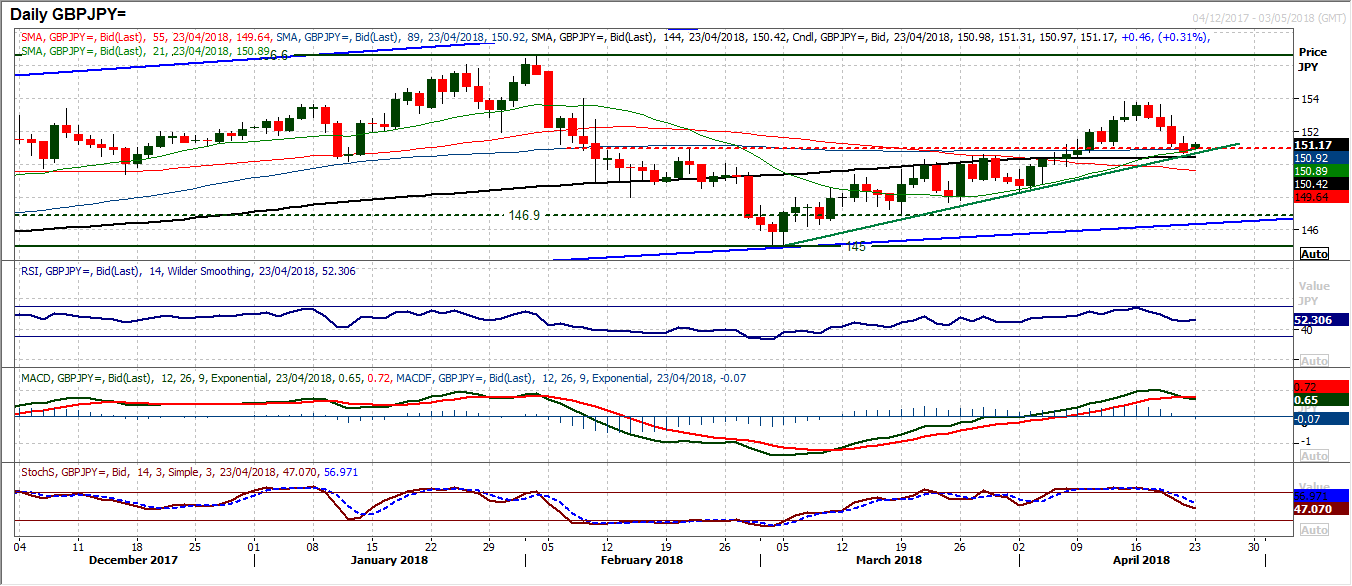
Sterling crosses have been hit hard with the dovish comments from BoE Governor Mark Carney late last Thursday. The question is whether the corrections will be bought into. Sterling/Yen is one such cross that has been pulled back to key technical levels and will be seen as being at a significant turning point now. The breakout above 151.00 a couple of weeks ago was a key technical improvement which was effectively the neckline of a base pattern that implied around 600 pips of further recovery in the coming months. The bulls will now look to see if the pullback can now form support around the neckline, but also with the rising support of the 21 day moving average (today around 150.90) and the recovery uptrend support (today at 150.65) means this is a confluence of support now. The hourly chart shows the corrective outlook with the near term negative outlook on RSI and MACD clear to see. The bulls would need a move above Friday’s high at 151.70 to improve the position, but there is a band of resistance now in at 152.00/152.95.
EUR/USD
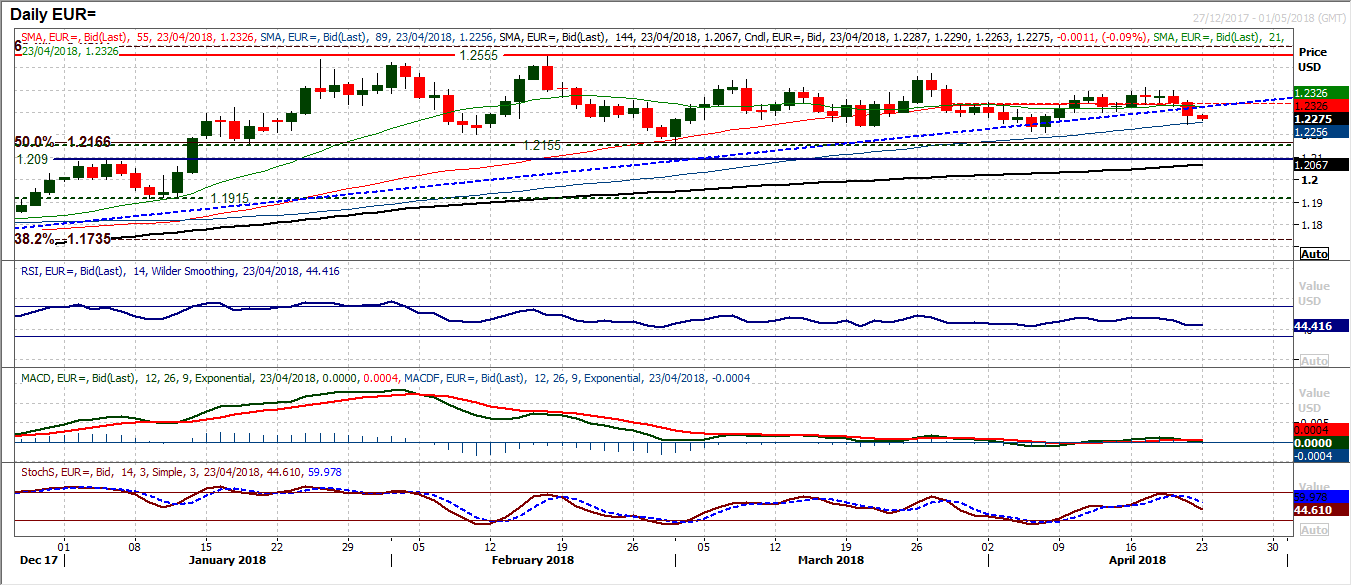
The negative momentum within the multi-month range is now growing after two completed negative candles but more importantly a decisive break of the 2 month uptrend. A loss of support at $1.2300 on Friday has re-opened the early April low at $1.2210 and with the near term technical signals deteriorating there is a growing pressure to the supports of the range now. The old support at $1.2300 is now a basis of resistance (shown already on Friday afternoon) and there is now a near term sell-zone between $1.230/$1.2345, whilst the early move today is lower which suggests that the selling pressure is continuing today. Near term rallies within the range are now a chance to sell for a test of $1.2210 whilst the range low at $1.2155 will also come into view should the selling continue. Resistance at $1.2413 is now key.
GBP/USD
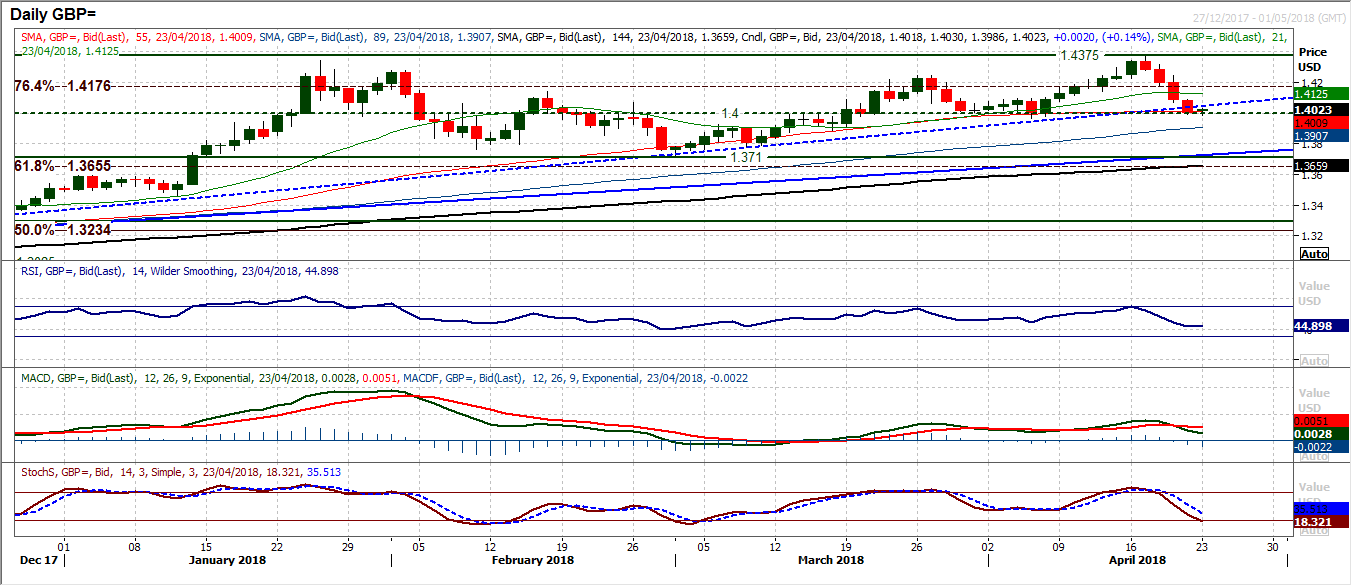
This is now a key moment for the Cable bulls. The near term outlook has taken a significant turn for the worse in the past few sessions with four consecutive strong bear candles. This move has now broken the support of the five month uptrend and seen the market retreat to the medium term pivot support around the psychological $1.4000 level. For months now the corrections have been bought into and left a string of higher lows. The support at $1.3965 is now very important on a medium term basis, as for the past nine months, Cable has not broken a medium term higher low. This is a key crossroads now, with momentum indicators unwinding near term but back to a key level on the RSI which has not been below 40 since October. The hourly chart shows the outlook is clearly corrective near term with the momentum configuration of the RSI failing under 60 and going back to below 30, whilst the MACD lines are consistently below neutral. The bulls need to get back above $1.4100 which has previously been a pivot and is again a basis of resistance, whilst a near term downtrend also comes in around that level today. Below $1.3965 initially opens $1.3885 but also opens the next medium term low at $1.3710.
USD/JPY
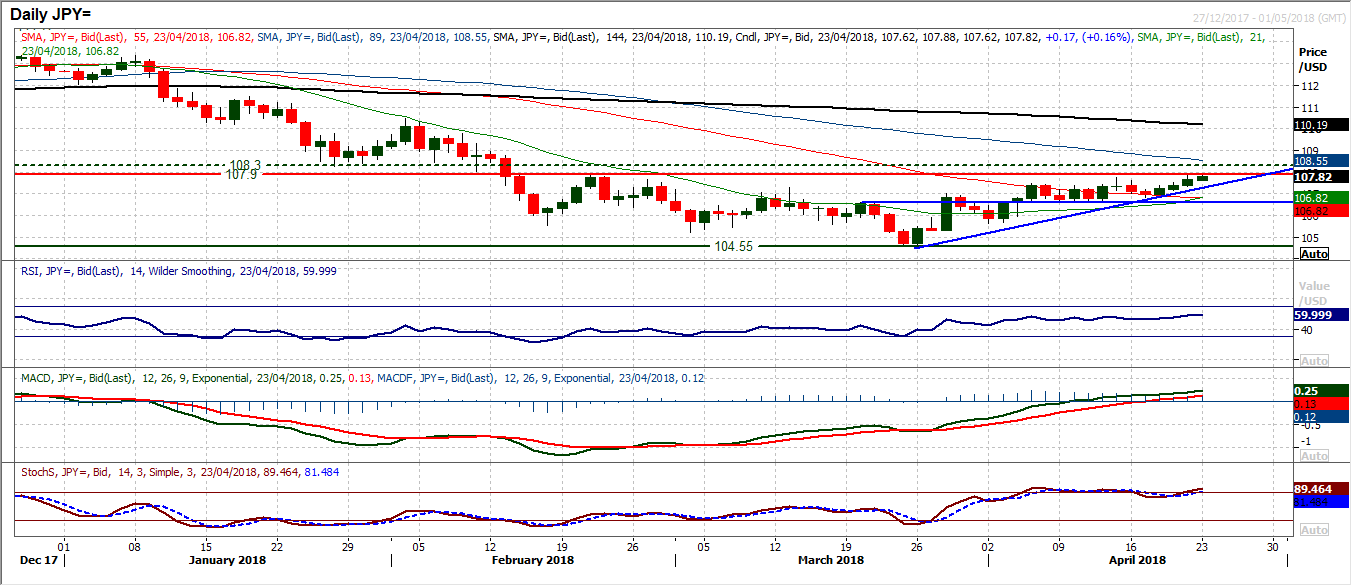
The strengthening dollar now stands at the brink of a significant technical improvement. For months the market has been effectively trading sideways in a range below 107.90. However, after three consecutive positive candles the market is now gathering momentum for a key breakout that would confirm a shift in outlook. Having pushed higher from a higher low at 106.60, the dollar bulls are increasingly in control of the medium term outlook and a close above 107.90 would imply the lower reaction lows of the February into March sell-off would have all been taken out. This would then open an old trading range 108.30/110.50. Momentum indicators are increasingly positive on the medium term basis with the MACD lines rising above neutral, Stochastics positively configured and a close on the RSI above 60 would be the first time since November. The bulls will be intent on holding on to what is now a slightly shallower recovery uptrend at 107.30 today. Subsequent support is at 106.85.
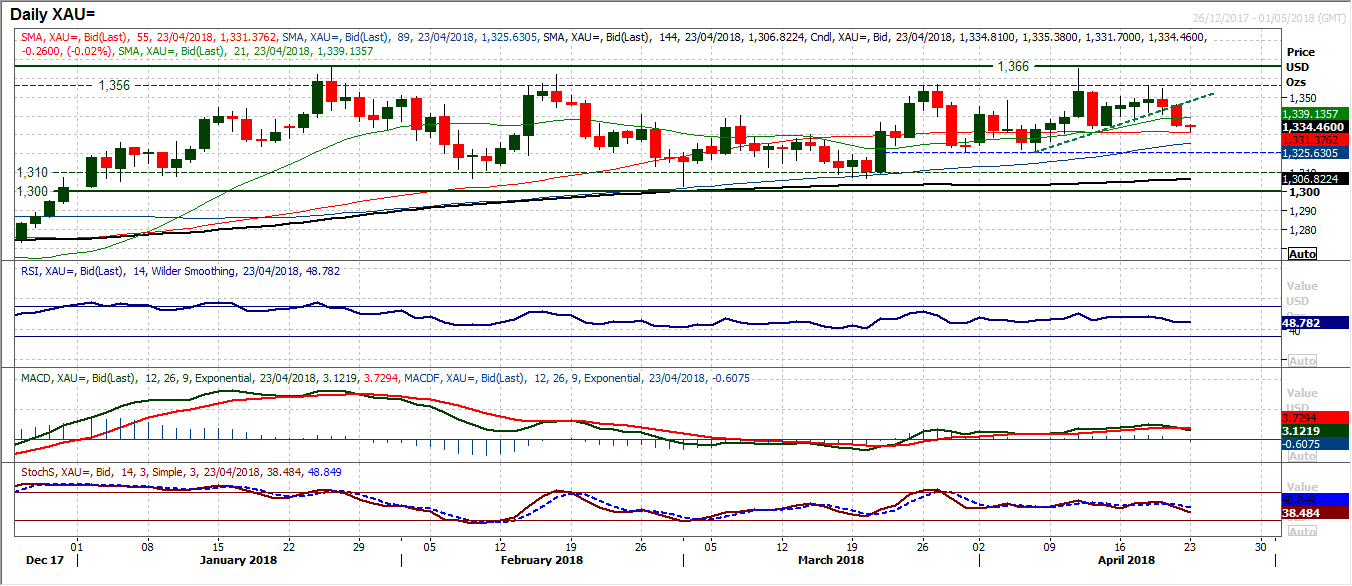
Gold
Another chart that the strengthening dollar is impacting shows gold rolling over again within the range. Friday’s strong negative candle cut $11 off the price and sees momentum starting to build to the downside. The initial support at $1333.50 has been breached and this now opens the early April higher low at $1321. The Stochastics are falling at a one month low and the RSI is back under 50 again. Although there is still little suggestion yet that the market is going to be breaking the multi-month range, the outlook is certainly threatening to turn decisively corrective within the range. The support at $1321 is key to this. The hourly chart shows resistance around $1340 initially and a small pivot at $1348 under the $1356 near term high. Near term rallies are now being sold into.
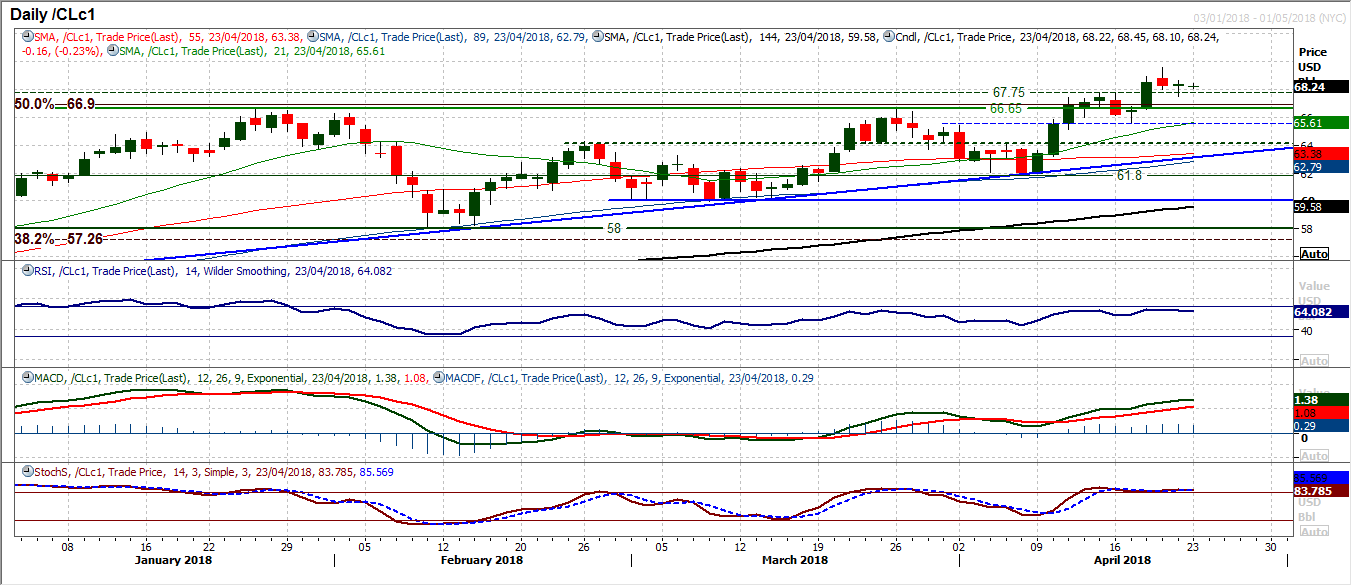
WTI Oil
With Donald Trump tweeting about how OPEC is keeping oil artificially high, the price has threatened a slip. Thursday’s negative candle left a high at $69.55 and despite a late session bounce back (from $67.50), a corrective move still could be seen. The key now is how the market reacts to the initial breakout support band $66.65/$67.75 as the market unwinds. Any weakness would still be a corrective move within the medium and longer term bull market, but if the support of the reaction low at $65.55 is broken then the corrective move could accelerate. The hourly chart shows minor resistance at $68.60 which the bulls would be looking to overcome to look to regain positive momentum once more. With the strength of the momentum indicators continuing in their bullish configuration this will continue to be a market to buy into near term weakness. Key resistance at $69.55.
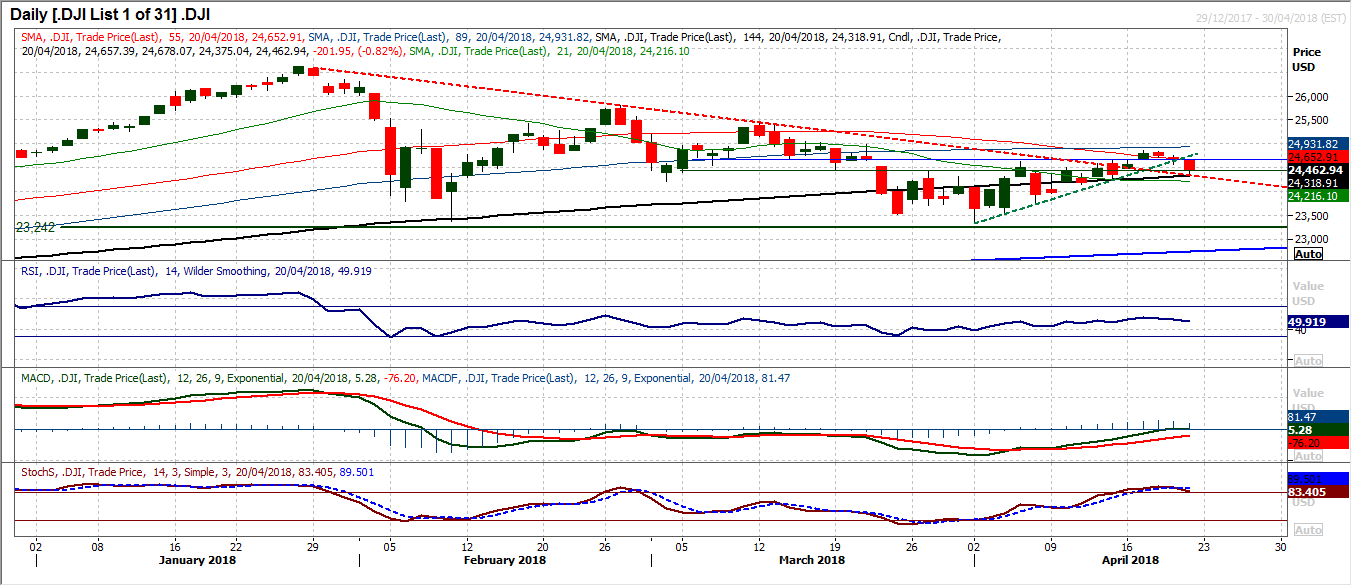
Dow Jones Industrial Average
The momentum in the recovery is in danger of being lost as the Dow is now testing the lows of the pivot band support 24,450/24,650. The market has posted three consecutive negative candlesticks and the positive outlook is now slipping. The top-side of the old downtrend is supportive at 24,300 today but this is a move that is becoming increasingly of worry, especially if the move turns into a fourth and a fifth consecutive bearish candle. The concern on a medium term basis is that this deterioration is coming with the Stochastics which have now crossed lower and the MACD lines which are rolling over around neutral. The Stochastics have not yet confirmed a sell signal but the last time it did was at the key February high, a level from which the market is yet to recover back to. The hourly chart shows that the current move is within the bounds of an acceptable correction but there is a support band 24,510/24,620 that needs to remain intact to sustain the positive configuration. A loss of support of the higher reaction low at 24,244 would put the bears back in control.
Author

Richard Perry
Independent Analyst


