Dollar index maintains bearish course and overthrows 200-day SMA

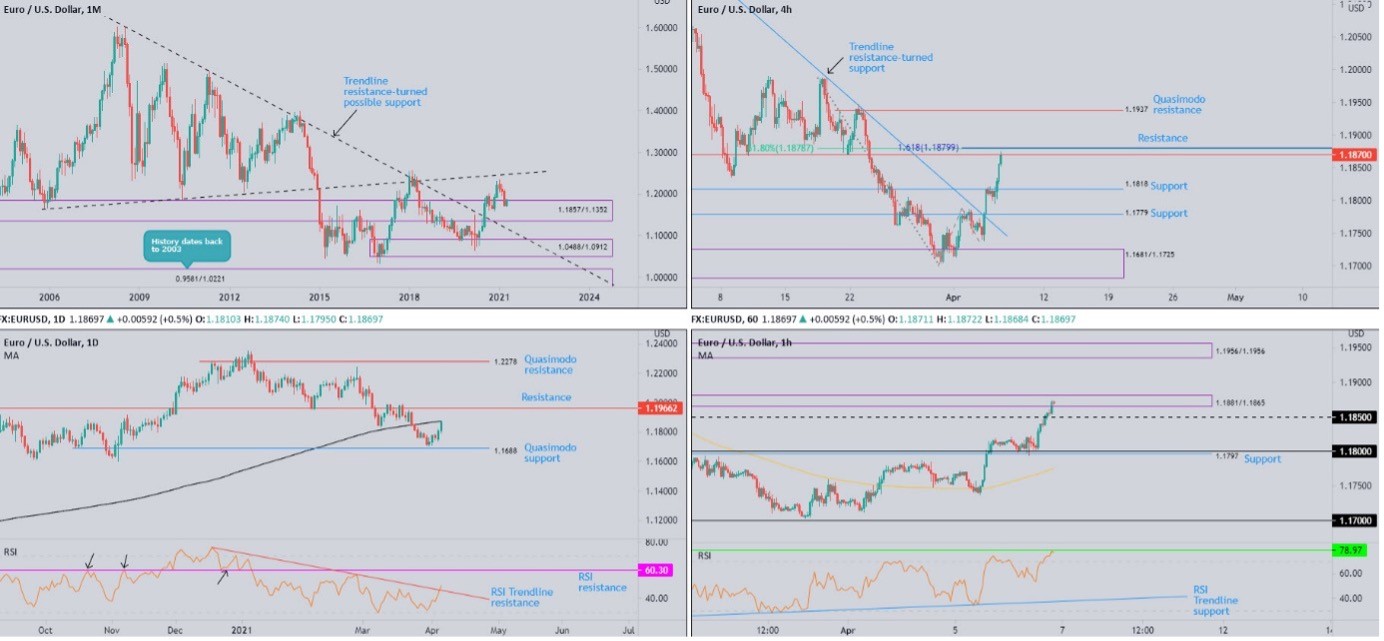
EUR/USD:
Monthly timeframe:
(Technical change on this timeframe is often limited, though serves as guidance to potential longer-term moves)
March carved out a third consecutive loss, extending the 2021 retracement slide by 2.8 percent.
Recent underperformance, as you can see, pulled EUR/USD into the walls of demand at 1.1857/1.1352. A rebound from the aforesaid demand shifts attention to the possibility of fresh 2021 peaks and a test of ascending resistance (prior support – 1.1641). Extending lower, on the other hand, shines the technical spotlight on trendline resistance-turned support, taken from the high 1.6038.
In terms of trend, the primary uptrend has been underway since price broke the 1.1714 high (Aug 2015) in July 2017.
Daily timeframe:
Partly modified from previous analysis.
Tuesday witnessed EUR/USD extend recovery gains, bolstered on the back of the DXY slicing below its 200-day simple moving average and US Treasury yields dropping more than 3 percent.
Up by half a percent, EUR/USD is currently on the doorstep of the 200-day simple moving average around 1.1876, with a break here uncovering resistance at 1.1966. Any bearish reaction emerging from the aforementioned SMA could have sellers take aim at Quasimodo support from 1.1688.
As for trend on the daily scale, we’ve been higher since early 2020.
From the RSI oscillator, the value swept through the 50.00 centreline and trendline resistance, drawn from the peak 76.00. This shines light on resistance at 60.30.
H4 timeframe:
Tuesday’s outperformance threw light on a somewhat muscular resistance at 1.1870, welcoming additional resistance in the form of a nearby 61.8% Fib level from 1.1878 and a 1.618% Fib extension at 1.1879.
Upstream displays another layer of resistance at 1.1937, shaped by way of a Quasimodo formation, while any downside moves today has support at 1.1818 in the firing range.
H1 timeframe:
Early London hours observed short-term flow retest the 1.18 figure on Tuesday, reinforced by a support level at 1.1797. As you can see, heading into US trading, EUR/USD bulls went on the offensive and recently overturned 1.1850 resistance to test supply at 1.1881/1.1865, an area sharing chart space with the 200-day simple moving average on the daily scale.
With respect to RSI movement, the value recently broke into overbought space and is closing in on resistance drawn from 78.97 (a level in play since the beginning of 2021).
Observed levels:
Aside from monthly price toying with demand from 1.1857/1.1352, the daily timeframe is within shouting distance of the 200-day simple moving average at 1.1876, along with H4 testing resistance around 1.1870 and the H1 greeting supply at 1.1881/1.1865 in recent hours. This promotes a bearish tone; a H1 close under 1.1850 may add bearish conviction.
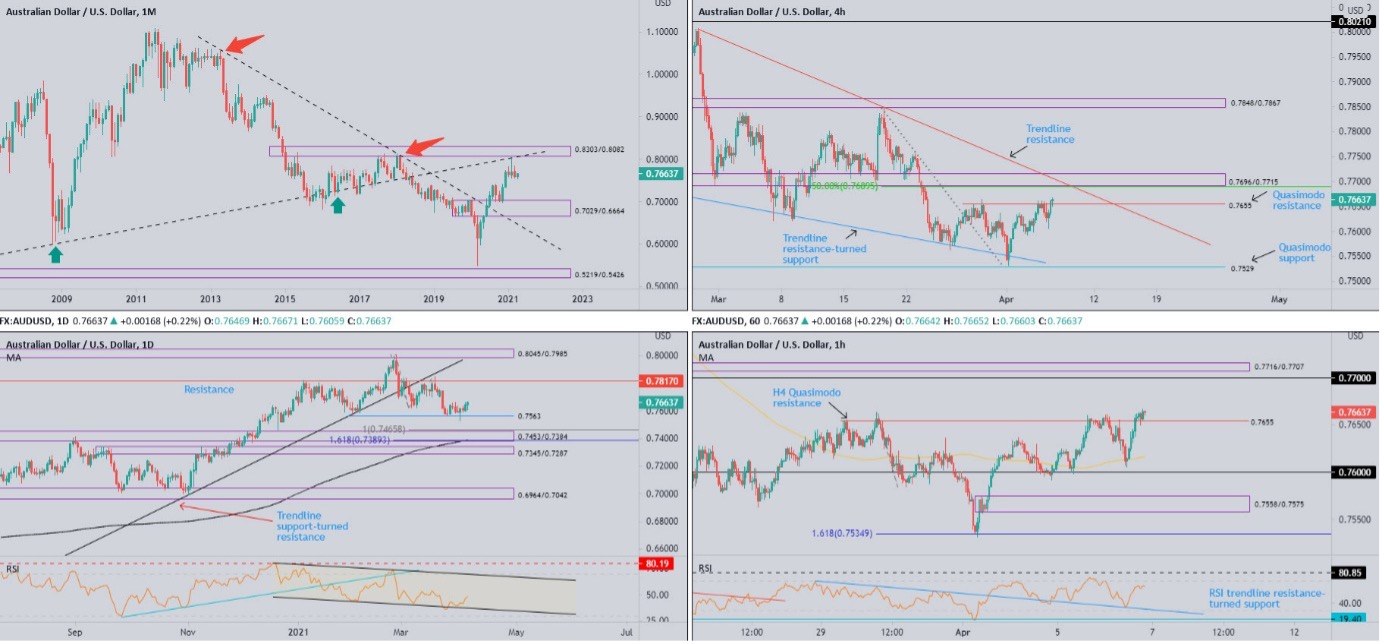
AUD/USD:
Monthly timeframe:
(Technical change on this timeframe is often limited, though serves as guidance to potential longer-term moves)
February finished considerably off best levels, establishing what many candlestick fans call a shooting star pattern—a bearish signal found at peaks. What’s interesting was February also came within striking distance of trendline resistance (prior support - 0.4776), sheltered under supply from 0.8303/0.8082.
March erased 1.5% over the Month and probed February’s lows. Should subsequent Months see sellers take the reins, demand is in view at 0.7029/0.6664 (prior supply).
With respect to trend (despite the trendline resistance [1.0582] breach in July 2020), the primary downtrend (since mid-2011) remains in play until breaking 0.8135 (January high [2018]).
Daily timeframe:
Largely unchanged from previous analysis.
The Australian dollar eked out modest gains against a softer USD on Tuesday, emphasising bullish intent north of the 0.7563 February low, which, as you can see, delivered supportive structure heading into the closing stages of March.
An extension to the upside shines light on resistance at 0.7817, while sellers regaining consciousness could have price take aim at demand from 0.7453/0.7384 (dovetailing closely with a 100% Fib extension at 0.7465 and a 1.618% Fib projection at 0.7389). Technicians will also note the 200-day simple moving average circling nearby at 0.7390.
Trend studies reveal the unit has been higher since early 2020.
As for the RSI oscillator, the value remains reinforced off channel support, taken from the low 43.70, and is currently nearing the underside of 50.00.
H4 timeframe:
Persistent bullish flow has placed Quasimodo resistance at 0.7655 in a vulnerable setting. Current price is threatening higher moves to test supply at 0.7696/0.7715, which happens to merge with trendline resistance, printed from the high 0.8007, and a 50.0% retracement value at 0.7689.
H1 timeframe:
A closer reading of price action on the H1 scale reveals the unit retesting the H4 Quasimodo resistance at 0.7655 as support, following an earlier rebound from the 100-period simple moving average around 0.7614. This implies buyers could push for the 0.77 figure, a psychological level sheltered under supply at 0.7716/0.7707 (an important zone given it were here a decision was made to break beneath 0.77).
RSI flow, as you can see, aided the 100-period simple moving average by testing trendline resistance-turned support, taken from the high 69.00. Tuesday also settled within close proximity of overbought levels.
Observed levels:
In similar fashion to Tuesday’s technical outlook, the H4 Quasimodo resistance at 0.7655 hanging by a thread, together with daily price establishing a bullish narrative off the 0.7563 February low, suggests AUD/USD may form a short-term bullish scene today. Follow-through upside could target 0.77 and H1 supply at 0.7716/0.7707 (both structures share chart space with H4 supply at 0.7696/0.7715).
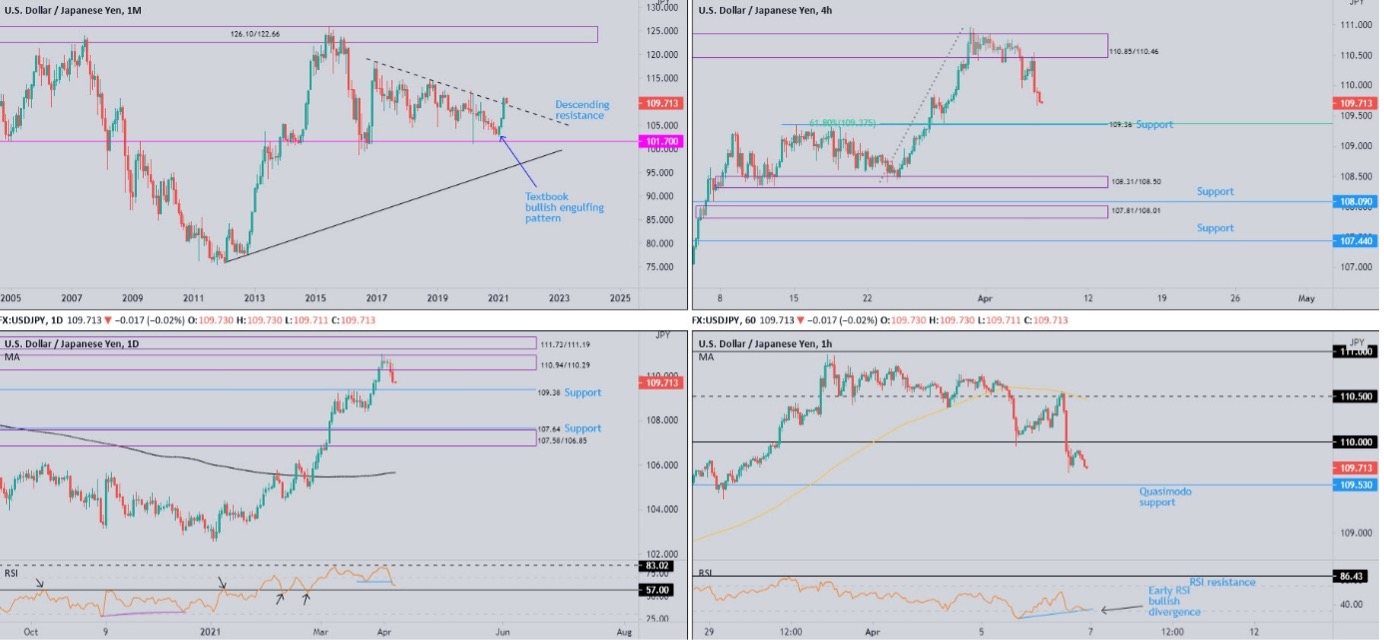
USD/JPY:
Monthly timeframe:
(Technical change on this timeframe is often limited, though serves as guidance to potential longer-term moves)
Following January’s bullish engulfing candle and February’s outperformance, March concluded up by 3.9 percent and marginally cut through descending resistance, etched from the high 118.66. Any sustained upside here highlights the possibility of continuation moves to as far north as 126.10/122.66 supply. Though before buyers attempt to climb, a retest of the breached descending resistance is likely to take shape.
Daily timeframe:
Amidst sliding US Treasury yields and a waning greenback, USD/JPY pencilled in a second consecutive bearish day from supply at 110.94/110.29 on Tuesday.
Next on tap, in the context of support, is the 109.38 base, a previous Quasimodo resistance level that coincides with the monthly timeframe’s descending resistance.
In terms of trend on the daily scale, we have been decisively higher since early 2021.
Latest developments also witnessed the RSI dip just south of resistance at 83.02 and exit overbought space, consequently forming an RSI swing sell signal (blue) and highlighting support around 57.00.
H4 timeframe:
After a fleeting visit to supply at 110.85/110.46 (housed within daily supply at 110.94/110.29) on Tuesday, sellers took the wheel and established a one-sided decline into the close.
Continuation selling points towards support at 109.36, a level sharing a connection with a 61.8% Fib level at 109.37. What’s also technically interesting is the monthly descending resistance-turned potential support and daily support at 109.38 sharing space with the noted H4 support.
H1 timeframe:
110.50 resistance dovetailing with the 100-period simple moving average proved an effective ceiling on Tuesday, holding back buyers as we transitioned into US hours.
Shaped by way of two dominant H1 bearish candles, price subsequently overpowered the 110 figure and touched a session low at 109.67. Territory south of current price highlights Quasimodo support at 109.53.
The RSI oscillator is in the process of developing bullish divergence as the value circles oversold territory.
Observed levels:
Having breached 110 on Tuesday, technical analysts are likely eyeballing H1 Quasimodo support priced in at 109.53. This remains an interesting base, aligning closely with H4 support at 109.36, daily support at 109.38, and the monthly descending resistance-turned possible support.
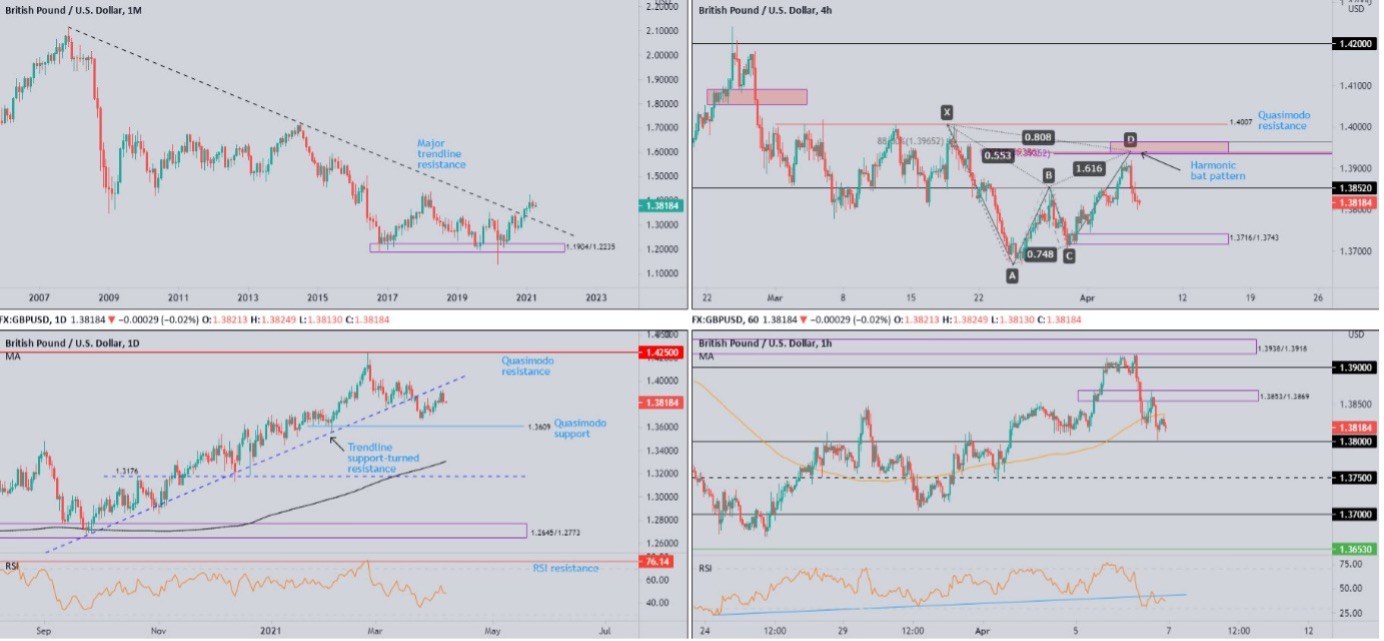
GBP/USD:
Monthly timeframe:
(Technical change on this timeframe is often limited, though serves as guidance to potential longer-term moves)
The pendulum swung in favour of buyers following December’s 2.5 percent advance, stirring major trendline resistance (2.1161). February followed through to the upside (1.7 percent) and refreshed 2021 highs at 1.4241, levels not seen since 2018. Contained within February’s range, however, March snapped a five-month winning streak and formed what candlestick enthusiasts call an inside candle pattern—represents a short-term consolidation with low volatility. A breakout lower tends to be considered a bearish signal.
Despite the trendline breach, primary trend structure has faced lower since early 2008, unbroken (as of current price) until 1.4376 gives way (April high 2018).
Daily timeframe:
Sterling, a clear underperformer, wrapped up Tuesday 0.5 percent lower against the US dollar and erased Monday’s gains (forming a bearish outside reversal). The pound also slipped against the euro, registering its worst day in five weeks.
Technically, GBP/USD put in a top just south of trendline support-turned resistance, extended from the low 1.1409. Additional weakness could eventually see the unit test the mettle of Quasimodo support at 1.3609.
With reference to trend, GBP/USD has been trending higher since early 2020.
The RSI failed to find acceptance north of the 50.00 centreline, informing traders that momentum to the upside could be weakening.
H4 timeframe:
Latest out of the H4 chart had price establish a top ahead of a harmonic bat pattern’s potential reversal zone (PRZ) between 1.3965 and 1.3937. Interestingly, the harmonic formation aligns closely with the daily trendline support-turned resistance.
As you can see, price went on to clear support at 1.3852 to test last Friday’s low at 1.3807. Further selling could bring in demand at 1.3716/1.3743.
H1 timeframe:
Early London on Tuesday saw price whipsaw through 1.39 offers and test fresh offers around supply at 1.3938/1.3918 (glued to the lower side of the H4 harmonic bat pattern’s PRZ at 1.3965/1.3937).
As evident from the chart, subsequent selling powered through 1.39 and demand at 1.3853/1.3869. This led price to the 100-period simple moving average around 1.3828, which supported a 1.3853/1.3869 retest to pull price under the SMA to within close range of 1.38 into the close.
With the RSI value showing upside contained by trendline support-turned resistance, drawn from the low 23.30, price may explore territory south of 1.38 today to target 1.3750, followed by the top side of H4 demand at 1.3743.
Observed levels:
In the absence of daily and H4 support, short-term flow may navigate space south of 1.38 today, in pursuit of 1.3850 support on the H1. A 1.38 retest as resistance, therefore, could be interesting.
Premium
You have reached your limit of 3 free articles for this month.
Start your subscription and get access to all our original articles.
Author

Aaron Hill
FP Markets
After completing his Bachelor’s degree in English and Creative Writing in the UK, and subsequently spending a handful of years teaching English as a foreign language teacher around Asia, Aaron was introduced to financial trading,


