Dollar Index firms off 91.00; EUR/USD poised to test $1.20

Chart Source: Trading View
EUR/USD:
Monthly timeframe:
(Technical change on this timeframe is often limited, though serves as guidance to potential longer-term moves)
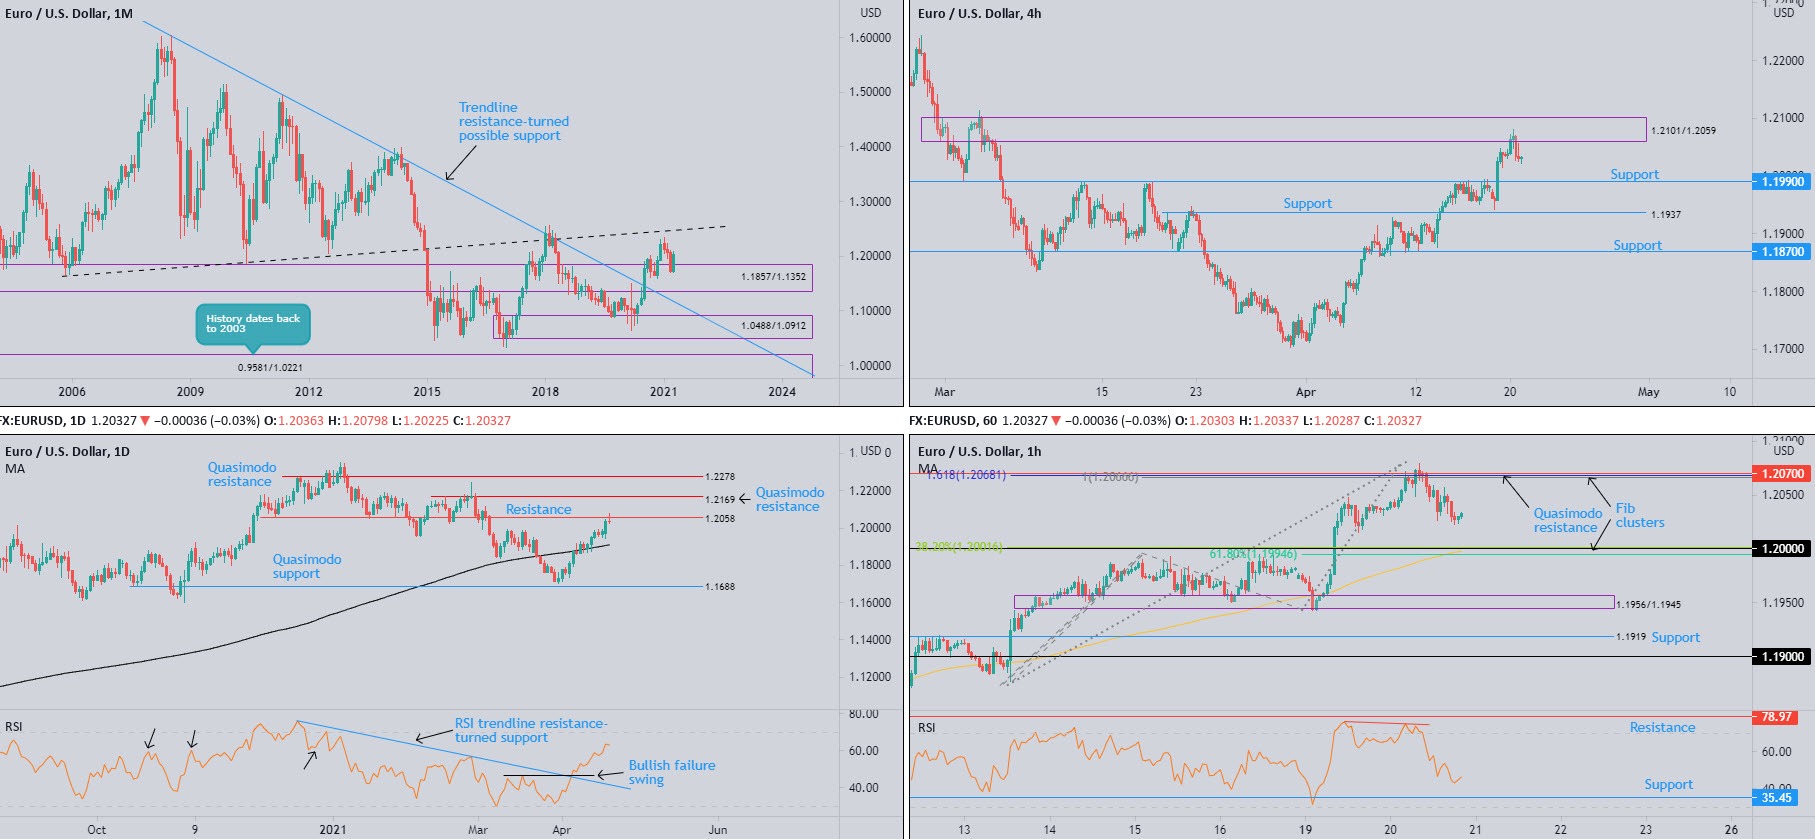
Following the three-month retracement slide, demand at 1.1857-1.1352 sparked a bullish revival in April, up 2.5 percent MTD. The possibility of fresh 2021 peaks is on the table, followed by a test of ascending resistance (prior support – 1.1641).
Spinning lower, on the other hand, shines the technical spotlight on trendline resistance-turned support, taken from the high 1.6038.
Based on trend studies, the primary uptrend has been underway since price broke the 1.1714 high (Aug 2015) in July 2017.
Daily timeframe:
On course to shape a shooting star—a candlestick pattern generally interpreted as a bearish signal at peaks—price action tested the resolve of sellers at resistance from 1.2058 on Tuesday.
Should the aforementioned movement rejuvenate selling, downside moves could address the 200-day simple moving average, currently plotted around the 1.1910ish neighbourhood. In the event buyers make an entrance, however, the next layer of resistance beyond 1.2058 can be seen at 1.2169: a Quasimodo formation.
Trend studies, despite the recent test of resistance at 1.2058, reveal EUR/USD has been trending higher since early 2020 (many analysts likely refer to this as the primary trend).
RSI flow, on the other hand, is seen closing in on overbought territory. Should we test this region, bearish hidden divergence is likely to present itself.
H4 timeframe:
With the US dollar index (ticker: DXY) displaying bullish intent off 91.00 Tuesday, EUR/USD supply elbowed into the spotlight at 1.2101-1.2059 and delivered a platform for sellers to work with. Technicians will note the aforesaid supply is stationed a pip north of daily resistance underlined above at 1.2058.
Support at 1.1990 calls for attention should further selling come to pass today, with a break pointing to Quasimodo resistance-turned support at 1.1937.
H1 timeframe:
Despite early hours attempting to navigate territory above Quasimodo resistance from 1.2070 and a neighbouring Fib cluster (1.618% Fib expansion at 1.2068 as well as a 100% projection at 1.2066), sellers took the wheel on Tuesday.
Travelling from a session top at 1.2079 on Tuesday, H1 candles appear poised to reconnect with the key figure 1.20, which happens to dovetail with a Fib cluster (38.2% Fib level at 1.2001 and a 61.8% Fib level at 1.1994). Also providing additional support is the 100-period simple moving average at 1.1998.
RSI action, following the formation of bearish divergence, which supported the sell-off from Quasimodo resistance at 1.2070, drilled through the 50.00 centreline on Tuesday (indicates further weakening of price movement could be on the cards). RSI support is arranged around 35.45.
Observed levels:
The daily timeframe’s shooting star from resistance at 1.2058 (reinforced by H4 supply at 1.2101-1.2059) unlocks the possibility of a bearish scenario today, targeting 1.20 on the H1 (secured just north of H4 support at 1.1990).
Should the unit reach 1.20 (a level fused with Fib confluence as well as the 100-period simple moving average) and the aforesaid H4 support, buyers could attempt to make a comeback.
AUD/USD:
Monthly timeframe:
(Technical change on this timeframe is often limited, though serves as guidance to potential longer-term moves)
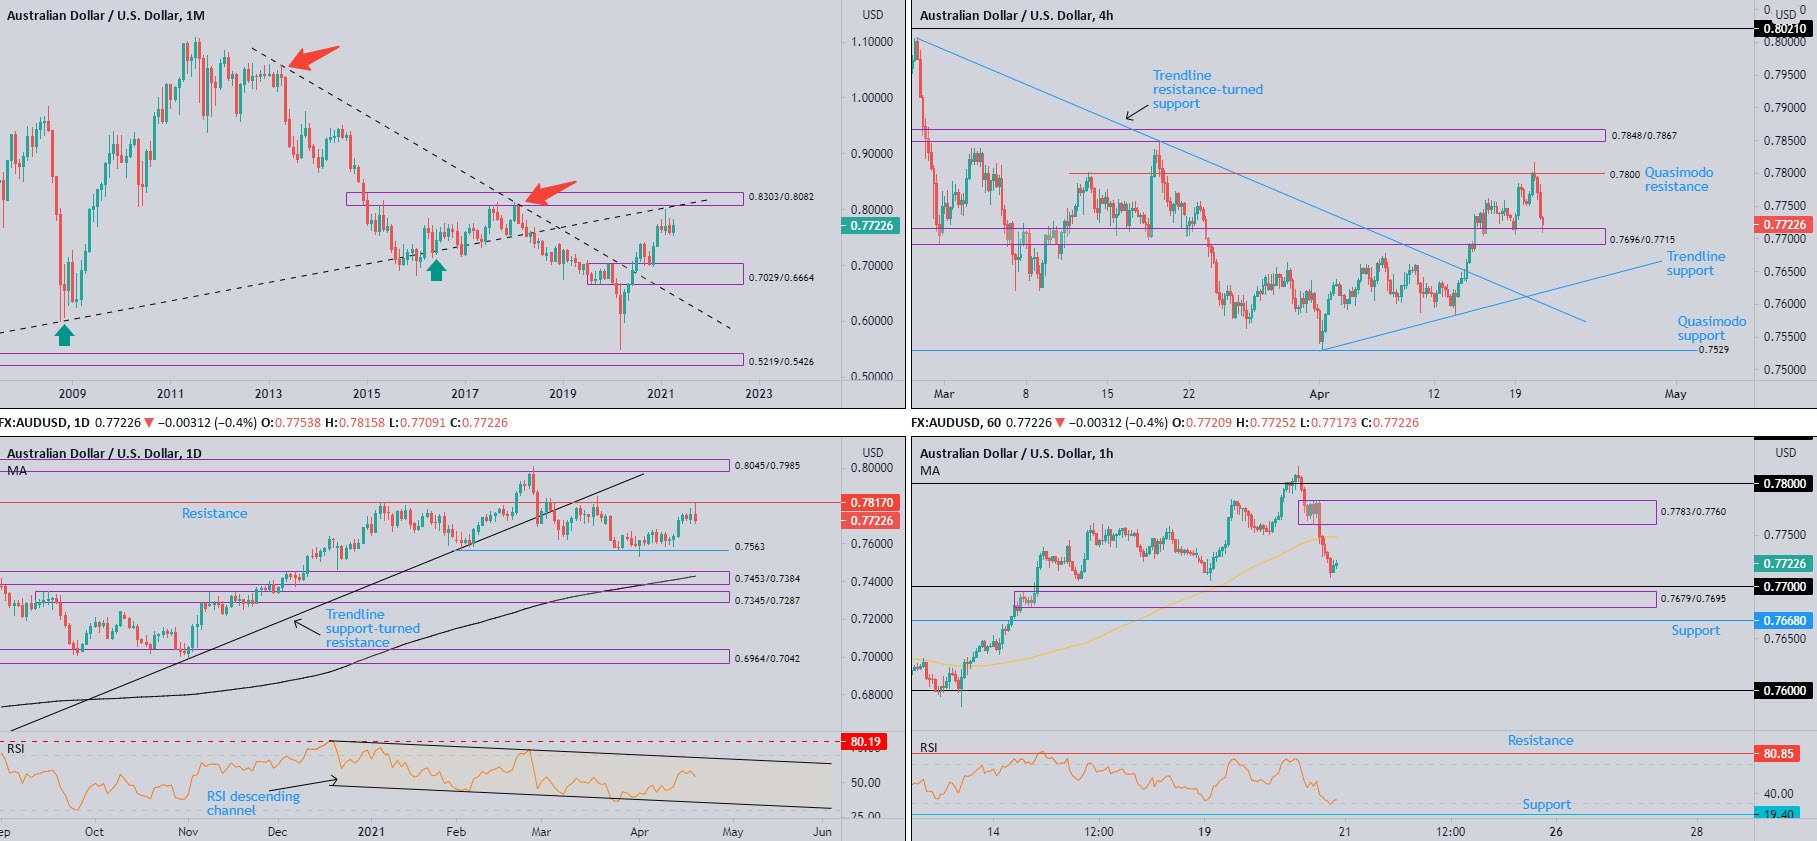
Since the beginning of 2021, AUD/USD has been consolidating just south of trendline resistance (prior support - 0.4776 high) and supply from 0.8303-0.8082.
Should a bearish move unfold over the coming months, demand at 0.7029-0.6664 (prior supply) is featured to the downside.
With respect to trend (despite the trendline resistance [1.0582] breach in July 2020), the primary downtrend (since mid-2011) remains in play until breaking 0.8135 (January high [2018]).
Daily timeframe:
AUD/USD action adopted a bearish position on Tuesday after coming within a pip of testing resistance at 0.7817, down by 0.4 percent at the close. With the US dollar index discovering support off 91.00, an extension lower could develop today, targeting the 0.7563 February low.
Momentum, according to the RSI oscillator, hovers above the 50.00 centreline. Increased interest to the upside, however, could have the value cross swords with channel resistance, drawn from the high 80.12.
H4 timeframe:
0.7696-0.7715 demand welcomed price action in recent hours, following a one-sided decline from Quasimodo resistance at 0.7800.
Should 0.7696-0.7715 give way, this reopens the risk of a return to trendline support, extended from the low 0.7531.
H1 timeframe:
Supply at 0.7783-0.7760, as you can see, established itself following a failed attempt to overtake the 0.78 figure above.
The aforesaid supply is notable on this scale, seeing as how it was within this area a decision was made to push through the 100-period simple moving average at 0.7748 on Tuesday.
Although RSI flow shows signs of bottoming from oversold terrain, the 0.77 figure, alongside nearby demand at 0.7679-0.7695 is worth noting. Note the demand essentially represents the decision point to break above 0.77 in mid-April.
Observed levels:
Longer-term price action shows sellers could look to take control for the time being, according to the daily timeframe’s recent 0.7817 resistance rejection.
Across the charts on the shorter term, however, traders may attempt to pursue a bullish theme, particularly if we test the 0.77 figure on the H1 as this psychological level resides within the lower range of H4 demand at 0.7696-0.7715.
USD/JPY:
Monthly timeframe:
(Technical change on this timeframe is often limited, though serves as guidance to potential longer-term moves)
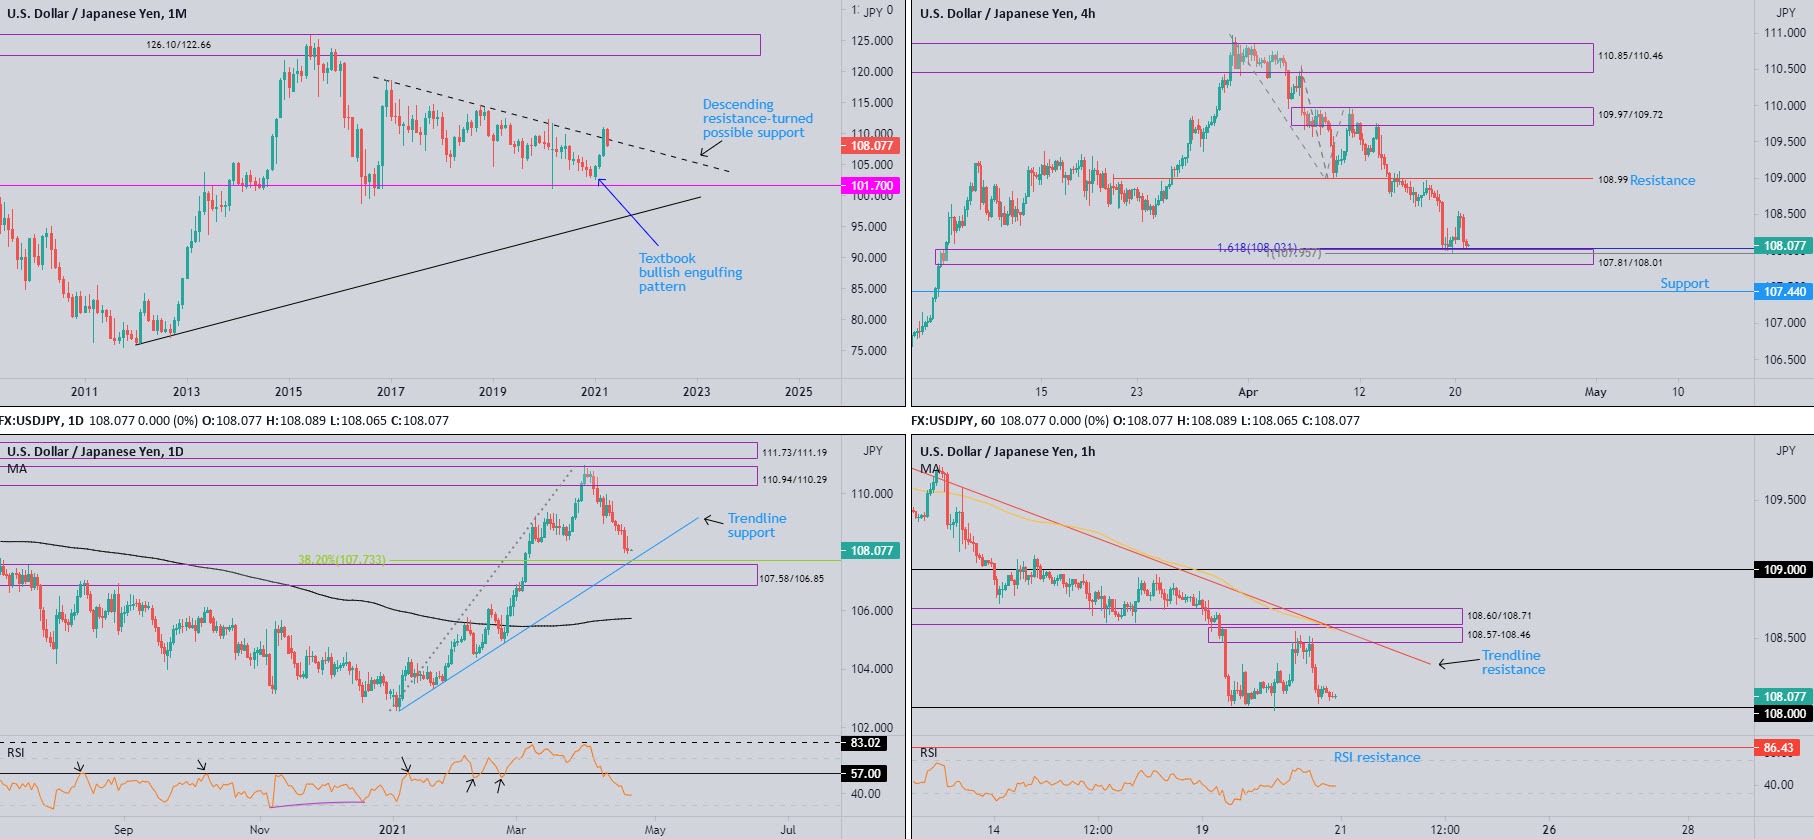
Following January’s bullish engulfing candle and February’s outperformance, March concluded up by 3.9 percent and marginally cut through descending resistance, etched from the high 118.66.
April, currently down 2.3 percent, is seen attempting to climb back through the breached descending resistance.
Daily timeframe:
Partly modified from previous analysis.
Global equities taking a hit benefited the safe-haven Japanese yen on Tuesday. This, along with US Treasury yields rotating below 1.6%, guided USD/JPY from session peaks.
This highlights the possibility of a move into trendline support, etched from the low 102.59, as well as demand plotted at 107.58-106.85 (prior supply) and a 38.2% Fib level at 107.73. Voyaging into the aforesaid areas underlines the possibility of a bullish revival.
In terms of trend on the daily scale, despite decisive selling in April, we have been trending higher since early 2021.
RSI action recently journeyed beneath support at 57.00, and dipped a toe under 40.00. This implies momentum remains to the downside for the time being, threatening moves into oversold space.
H4 timeframe:
Although reviving a bullish phase on Tuesday, demand at 107.81-108.01—benefits from a Fib cluster around 108ish—is back in the fight after failing to maintain a bid tone north of 108.50.
Should the aforesaid demand move aside today, this could welcome a swift sell-off to support at 107.44.
H1 timeframe:
A small, yet significant, supply at 108.57-108.46 made its way into the spotlight on Tuesday, an area sheltered south of supply at 108.60-108.71, as well as a trendline resistance, taken from the high 110.55.
The 108.57-108.46 rejection, as you can see, hauled the currency pair back to within striking range of the 108 figure. Territory south of the round number shines light on demand coming in at 107.52-107.65.
In terms of where we stand on the RSI indicator, the value is currently hovering just north of oversold waters following an earlier attempt to take on the 50.00 centreline.
Observed levels:
Largely unchanged outlook.
108 could still spark buying, given the level’s connection with H4 demand at 107.81-108.01 and Fib confluence.
However, should the pair explore lower levels and test H4 support at 107.44, this barrier packs more of a bullish punch, having seen the base align with daily demand at 107.58-106.85 (and associated technical confluence on the daily scale).
GBP/USD:
Monthly timeframe:
(Technical change on this timeframe is often limited, though serves as guidance to potential longer-term moves)
The pendulum swung in favour of buyers following December’s 2.5 percent advance, stirring major trendline resistance (2.1161). February subsequently followed through to the upside (1.7 percent) and refreshed 2021 highs at 1.4241, levels not seen since 2018.
Contained within February’s range, however, March snapped a five-month winning streak and formed what candlestick enthusiasts call an inside candle pattern (represents a short-term consolidation with low volatility). A breakout lower would generally be viewed as a bearish signal.
April, however, thanks to yesterday, is now trading higher by 1.1 percent.
Despite the trendline breach, primary trend structure has faced lower since early 2008, unbroken (as of current price) until 1.4376 gives way (April high 2018).
Daily timeframe:
Partly modified from previous analysis.
Bearish bets surfaced south of trendline support-turned resistance, taken from the low 1.1409, on Tuesday, consequently clawing back a portion of Monday’s upside.
Despite an upbeat UK labour market, GBP/USD wrapped up the session down by 0.4 percent.
Quasimodo support at 1.3609 continues to call for attention to the downside, a level aligning with interesting Fibonacci confluence.
As for trend, GBP/USD has been trending higher since early 2020.
RSI activity remains within touching distance of overbought waters (in particular resistance at 76.14) after cementing position above the 50.00 centreline.
H4 timeframe:
As evident from the H4 scale, Quasimodo resistance at 1.4007 welcomed sellers on Tuesday, delivering price action to lows just north of potential support parked at 1.3919. Downstream, we can also see another layer of support resting around 1.3852.
H1 timeframe:
Aided by an RSI overbought signal, 1.40 served well as resistance yesterday, capping upside for a sixth consecutive time since the beginning of March. Selling pressure led action into demand at 1.3938-1.3918 (prior supply), set ahead of 1.39 (aligns with a 38.2% Fib at 1.3897).
With reference to the RSI oscillator, the value shows signs of bottoming north of oversold, around the 39.00 area.
Observed levels:
The combination of possible H4 support at 1.3919, H1 demand at 1.3938-1.3918, together with the 1.39 figure, could encourage a bullish scene today, with buyers likely to take aim at 1.40ish.

Premium
You have reached your limit of 3 free articles for this month.
Start your subscription and get access to all our original articles.
Author

Aaron Hill
FP Markets
After completing his Bachelor’s degree in English and Creative Writing in the UK, and subsequently spending a handful of years teaching English as a foreign language teacher around Asia, Aaron was introduced to financial trading,


