|

Dollar Index (DXY) forecasting the rally after three waves pull back

In this technical article we’re going to take a quick look at the Elliott Wave charts of Dollar Index DXY , published in members area of the website. As our members know, Dollar is still trading within the cycle from the September’s low.  Recently, we saw a 3-wave pullback, followed by a solid rally as expected. In the further text, we are going to explain the wave count.

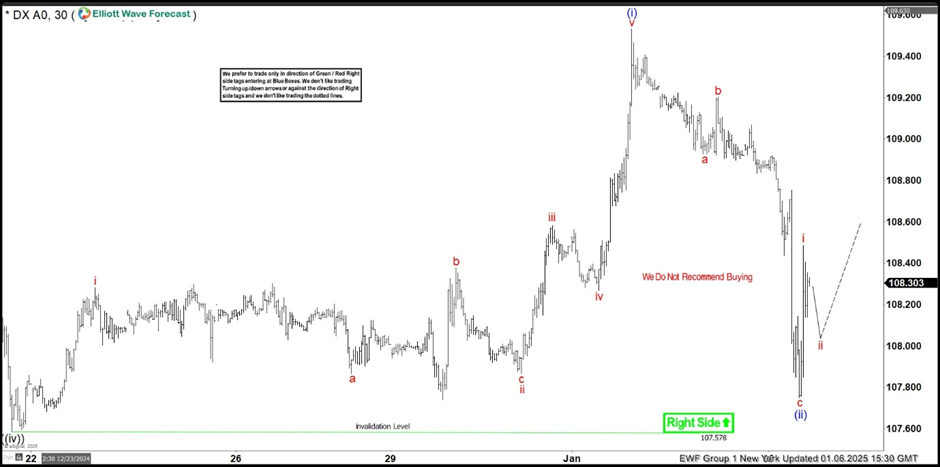
DXY H1 New York  01.06.2025

The current view suggests that the Dollar Index completed a 3-wave pullback from the peak, ending at the 107.751 low and labeled as wave ((ii)) blue. A sharp rally followed from this low, appearing impulsive. We have labeled this short-term cycle as wave i red, indicating the start of a new bullish cycle. A 3-wave pullback in wave ii red is anticipated before the rally resumes. We expect the Dollar Index to continue finding intraday sellers in 3, 7, and 11 swings.

Chart

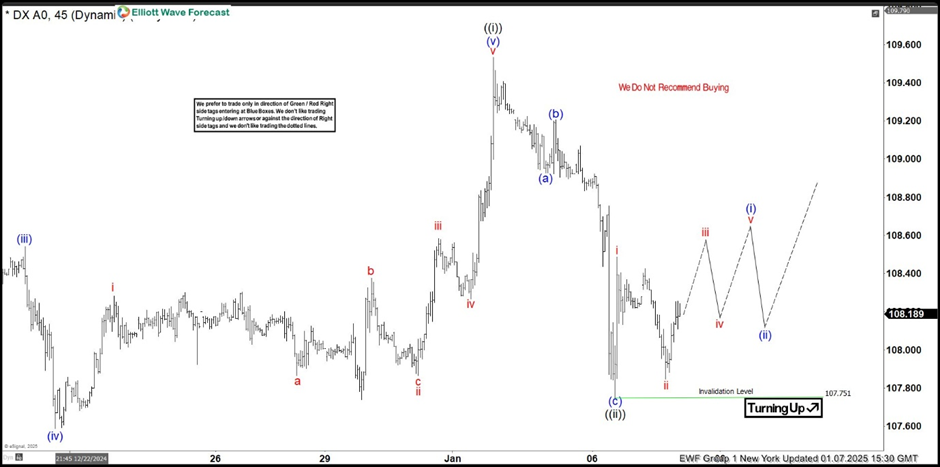
DXY H1 New York update 01.07.2025

We saw a 3-wave pullback in ii red, followed by a move up. The key level is 107.751. While the price stays above it, we expect more rally in the Dollar Index, ideally towards new highs. A break above the previous peak ((i)) black will confirm that wave ((iii)) is in progress.

Chart

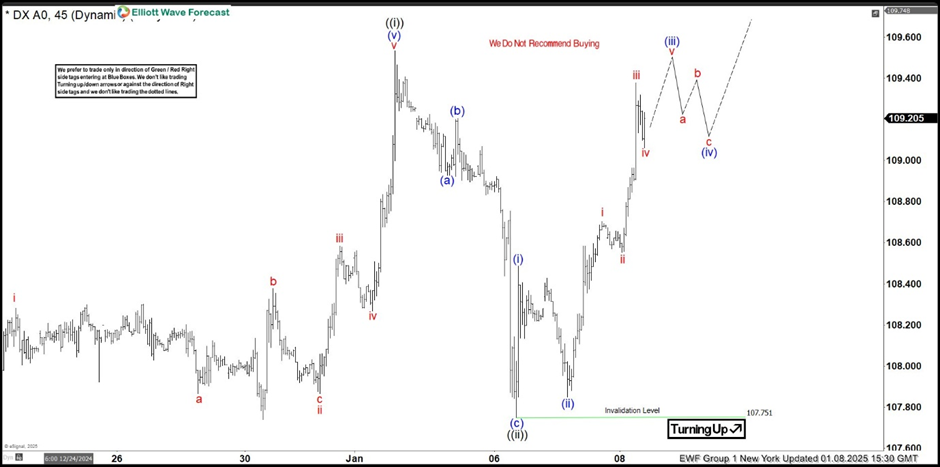
DXY H1 New York update 01.08.2025

The 107.751 low held as expected, and the price moved higher. We got a decent rally in Dollar index. The price is now approaching the previous peak, and we are looking for a break above wave ((i)) black to confirm further strength.

Chart

Author

Elliott Wave Forecast Team

Elliott Wave Forecast Team

ElliottWave-Forecast.com

More from Elliott Wave Forecast Team
Share:

Markets move fast. We move first.

Orange Juice Newsletter brings you expert driven insights - not headlines. Every day on your inbox.

By subscribing you agree to our Terms and conditions.

Editor's Picks

EUR/USD trims losses and returns to the 1.1750 area

The US Dollar resumed its decline in the American afternoon, helping EUR/USD trim early losses. The pair trades around 1.1750 as market participants gear up for the European Central Bank monetary policy decision and the United States Consumer Price Index.

GBP/USD flirts with 1.3400 after nearing 1.3300

The GBP/USD changed course after dipping with UK inflation data, and trades near the 1.3400 mark, as investors expect the Bank of England to deliver a 25 basis points interest rate cut after the two-day meeting on Thursday.

Gold maintains its positive momentum, trades around $4,330

The XAU/USD pair gained on a deteriorated market mood, trading near its weekly highs near $4,340. The bright metal advances with caution as market players await first-tier events in Europe and hte United States.

Bitcoin risks deeper correction as ETF outflows mount, derivative traders stay on the sidelines

Bitcoin (BTC) remains under pressure, trading below $87,000 on Wednesday, nearing a key support level. A decisive daily close below this zone could open the door to a deeper correction.

Monetary policy: Three central banks, three decisions, the same caution

While the Fed eased its monetary policy on 10 December for the third consecutive FOMC meeting, without making any guarantees about future action, the BoE, the ECB and the BoJ are holding their respective meetings this week. 

Crypto Today: Bitcoin, Ethereum, XRP slide further as risk-off sentiment deepens

Bitcoin faces extended pressure as institutional investors reduce their risk exposure. Ethereum’s upside capped at $3,000, weighed down by ETF outflows and bearish signals. XRP slides toward November’s support at $1.82 despite mild ETF inflows.