Dollar increasingly choppy with the US off for Presidents Day

Market Overview
The outlook for the dollar is becoming increasingly choppy as markets open in positive fashion but could struggle for decisive direction on Presidents Day in the US. After a couple of days of correction on Treasury yields the corrective move on the dollar has started to find support again. This has shown through in major markets as a move that is beginning to form a consolidation. This comes as markets will be on the lookout today for news of the next tranche of bailout money for Greece which is a hot topic for debate at the Eurogroup of finance ministers. Furthermore, markets will be increasingly waiting for further news of Trumps fiscal expansion plans. It is Presidents Day in the US, so this will mean a lack of steer from the bond markets in the US. This could mean more of a consolidation session today with traders unwilling to take a view ahead of news from the Eurogroup and Trump’s plans. May markets that I look at are forming into range patterns now in the past few days and it will be interesting to see what it takes to break them.

Wall Street closed marginally higher on Friday (S&P 500 +0.2% at 2351) with Asian markets mixed to mildly higher (Nikkei +0.1%) and European markets following a similar course today. Forex markets show a mildly positive risk sentiment today with the main mover being yen weakness. Gold is mixed, with the oil price around 0.5% higher in early moves.
With it being Presidents Day public holiday in the US today there is a light economic calendar for traders today. The Eurozone Consumer Confidence is at 1500GMT and is expected to stay at -5.
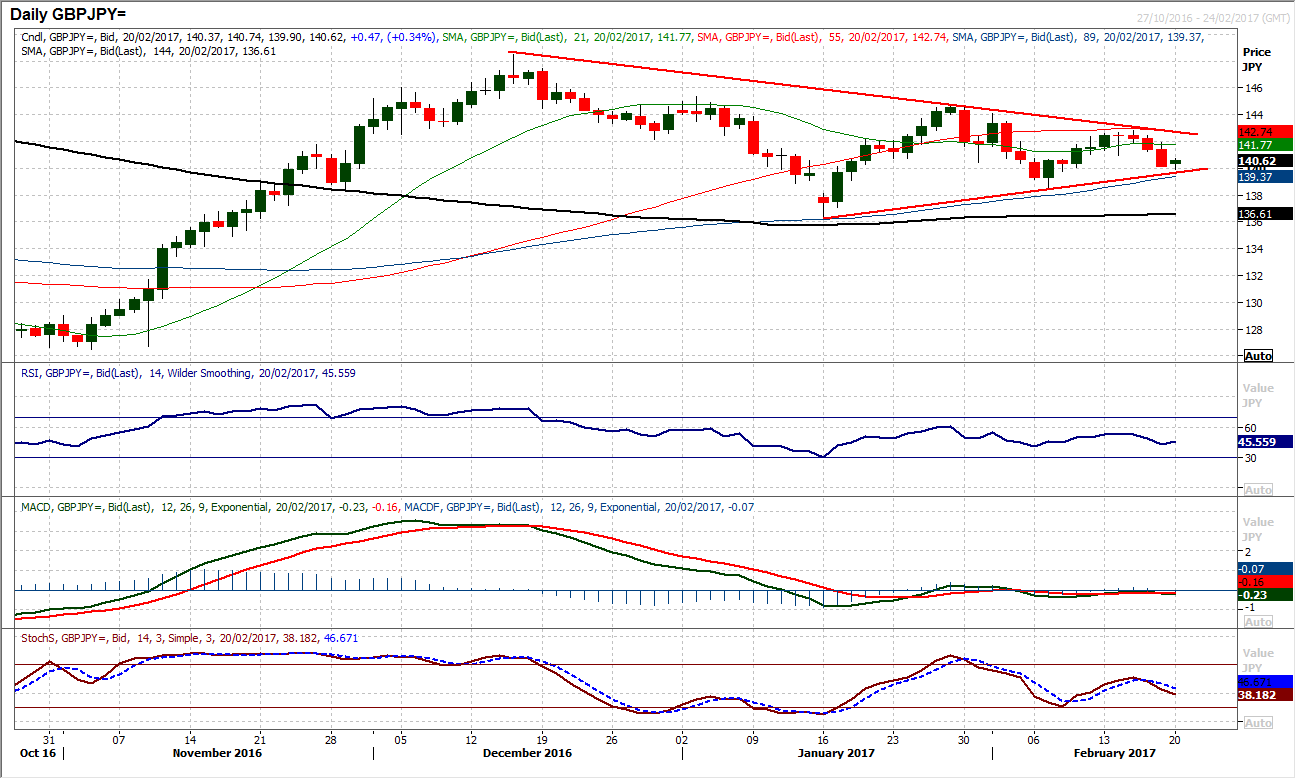
Chart of the Day – GBP/JPY
With sterling beginning to come under pressure from weaker UK economic data, in addition to the safe haven flow improving the prospects of the yen, the outlook for GBP/JPY has been coming under increasing pressure. The market has formed a consolidation triangle over the past couple of months and the downside support of the uptrend is now being tested. The bearish candles have been increasing in magnitude and the key February low at 138.50 is within sight. The momentum indicators have become ever more neutral over the past few weeks, however on Friday the Stochastics crossed lower and the RSI is also now tracking lower. Watch for the RSI dropping below 40 to be a trigger for the support at 138.50 (the February low) to come under pressure. The rising 89 day moving average has flanked the uptrend as the basis of support for the past month and this is at 139.20, and a breach would also help to provide confirmation of the deterioration. The hourly chart shows a decisive move below support at 141 completed a small top pattern that implies 180 pips of downside (to 139.20). The hourly momentum indicators are also now bearishly configured and suggest that with the early morning gains today, there is an opportunity for a rally back towards the 141 neckline with rallies now seen as a chance to sell. There is now an ideal “sell zone” of resistance between 140.50/141.00 today.
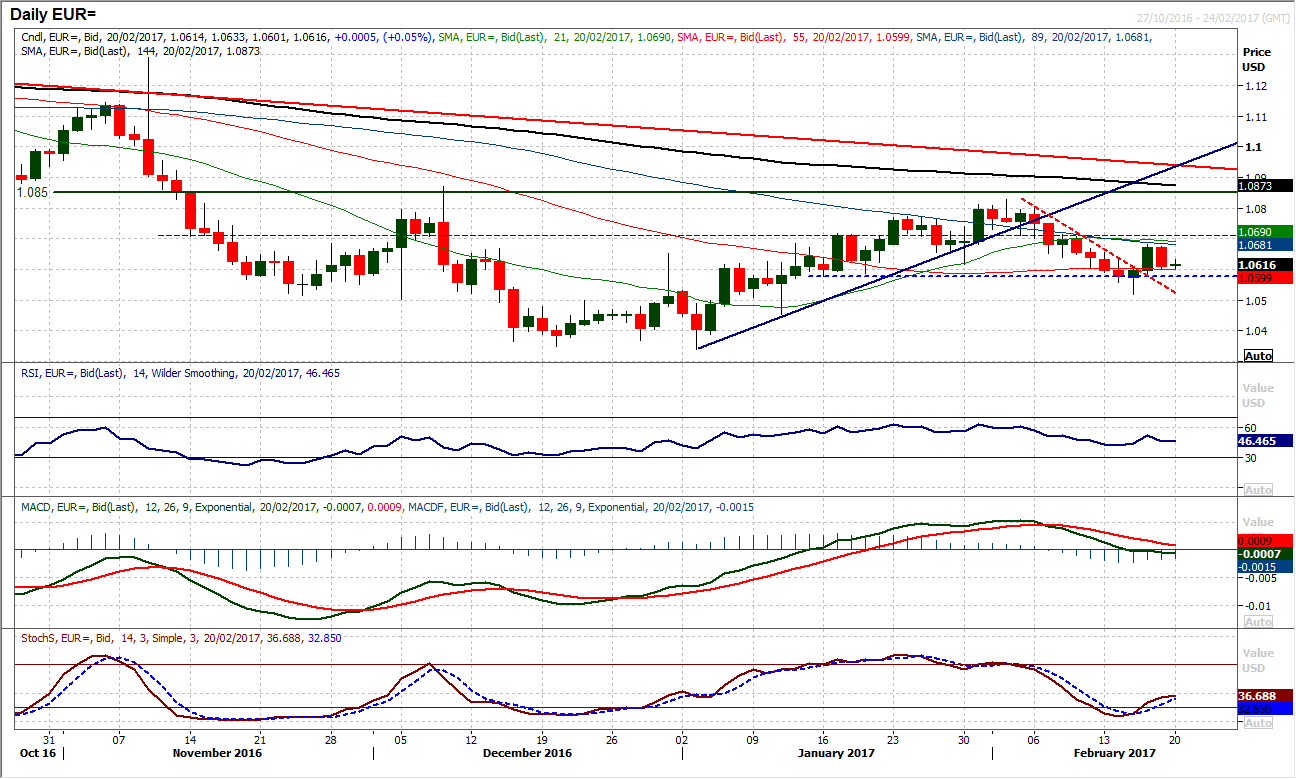
EUR/USD
Rallies remain a chance to sell on EUR/USD and Friday’s drop lower reflects a market where the bulls still occasionally have a go, but continue to fail with any real traction in a recovery. The pressure is subsequently back on the old to the downside with the old support at $1.0577 back in range. Friday’s bear candle all but matched the magnitude of Thursday’s bull move and this has effectively undone any significant thoughts of a rally and once more the momentum indicators are looking corrective again. The RSI is still below 50 and the Stochastics are rolling over again. The hourly chart has unwound the thoughts of a recovery, with moving averages neutral and a key high now in place at $1.0680 below the old pivot at $1.0710. Early moves today are marginally weaker and a breach of $1.0600 would re-open $1.0577 with $1.0520 key support. The volatility may be reduced with it being Presidents Day today but the outlook remains one to sell into strength.
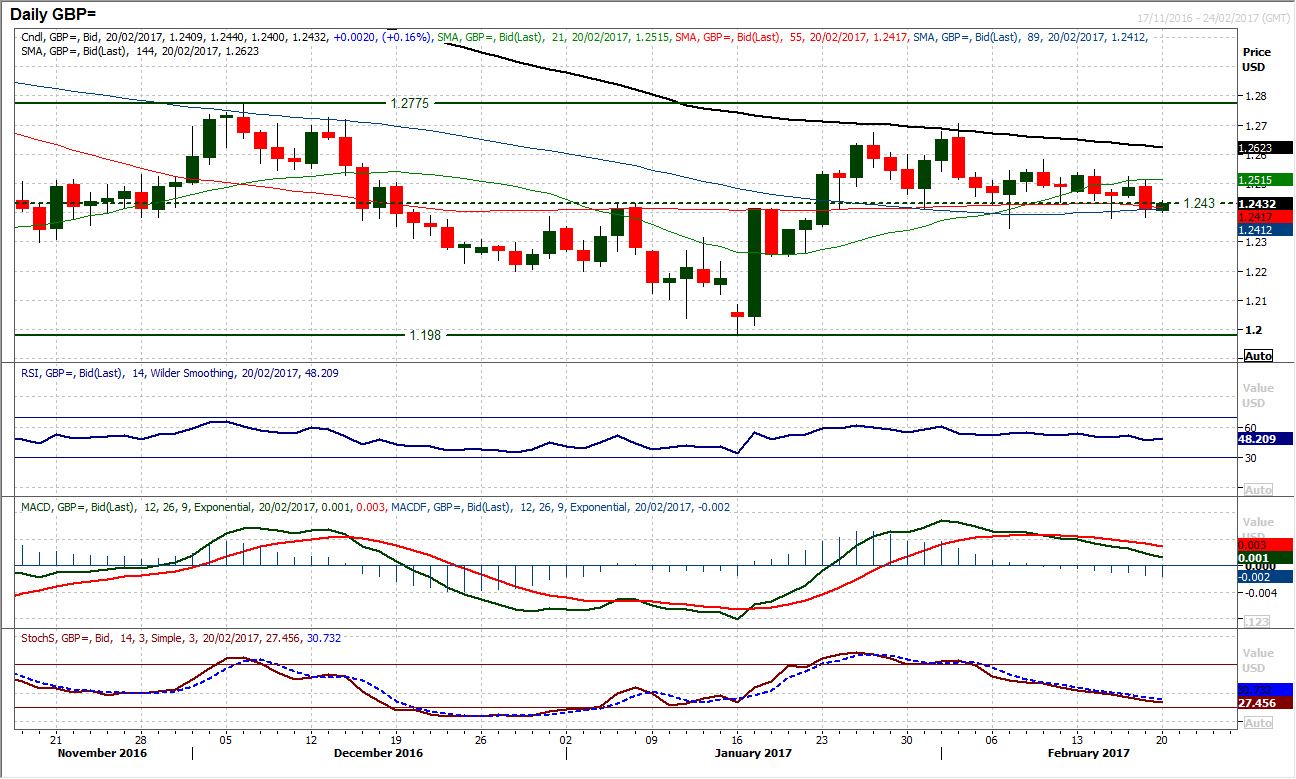
GBP/USD
There is a sense that the pair is drifting lower as a series of lower highs continues to be posted as the market has now finally broken below the support of the old breakout at $1.2430. On several occasions in the past few weeks, intraday moves below $1.2430 had been rebuffed into the close, however, finally on Friday a bearish candle with a solid body closed at $1.2412 and with this barrier now having been removed, the market will now be looking for further declines. The momentum indicators are certainly set up for it, with the RSI now below 50 for the first time in a month, whilst the MACD lines are falling and the Stochastics are in bearish decline. The hourly chart shows how an area of overhead supply now sits between $1.2430/$1.2470 with rallies seen as a chance to sell. The outlook is corrective and pressure on $1.2380 and $1.2345 can be expected in the coming days. Below $1.2345 the support comes in at $1.2250. Above $1.2525 resistance would improve the outlook.
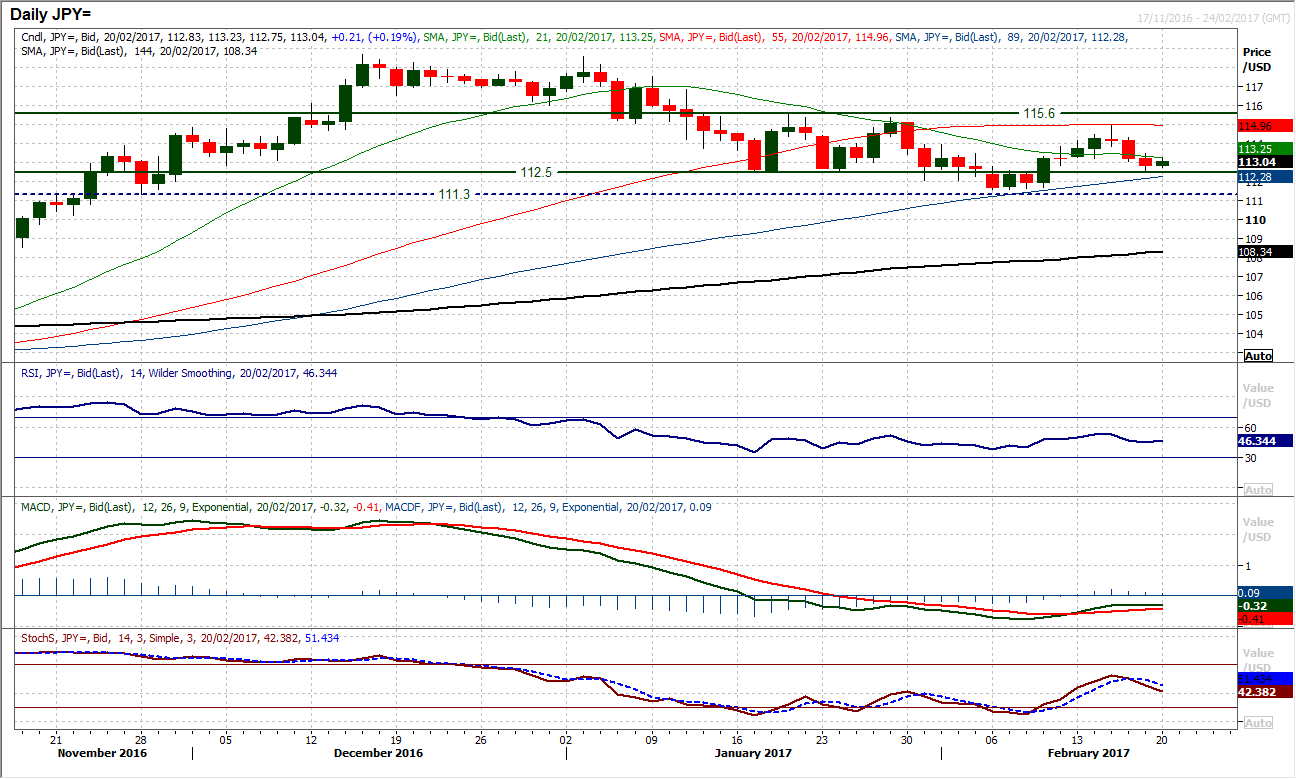
USD/JPY
The corrective move into Friday’s close suggests that the bulls do not have control of the market. The recovery has been broken and momentum indicators have taken on a far more neutral outlook. Taken across the course of the past few weeks, the market has become a neutral range play, as the moves that look to form trends consistently fail. The old pivot at 112.50 is once more back in play and has helped to prevent the recent decline from getting away, helping to maintain a medium term consolidation outlook. The hourly chart has become more neutrally configured too as the move early today has broken the three day downtrend and improved hourly momentum indicators. The support around 112.50 remains a key gauge for the outlook as a breach would re-open 111.60 and be a big breakdown again. For the bulls there is now a band of resistance starting at 113.50 up towards an old pivot at 114.00.
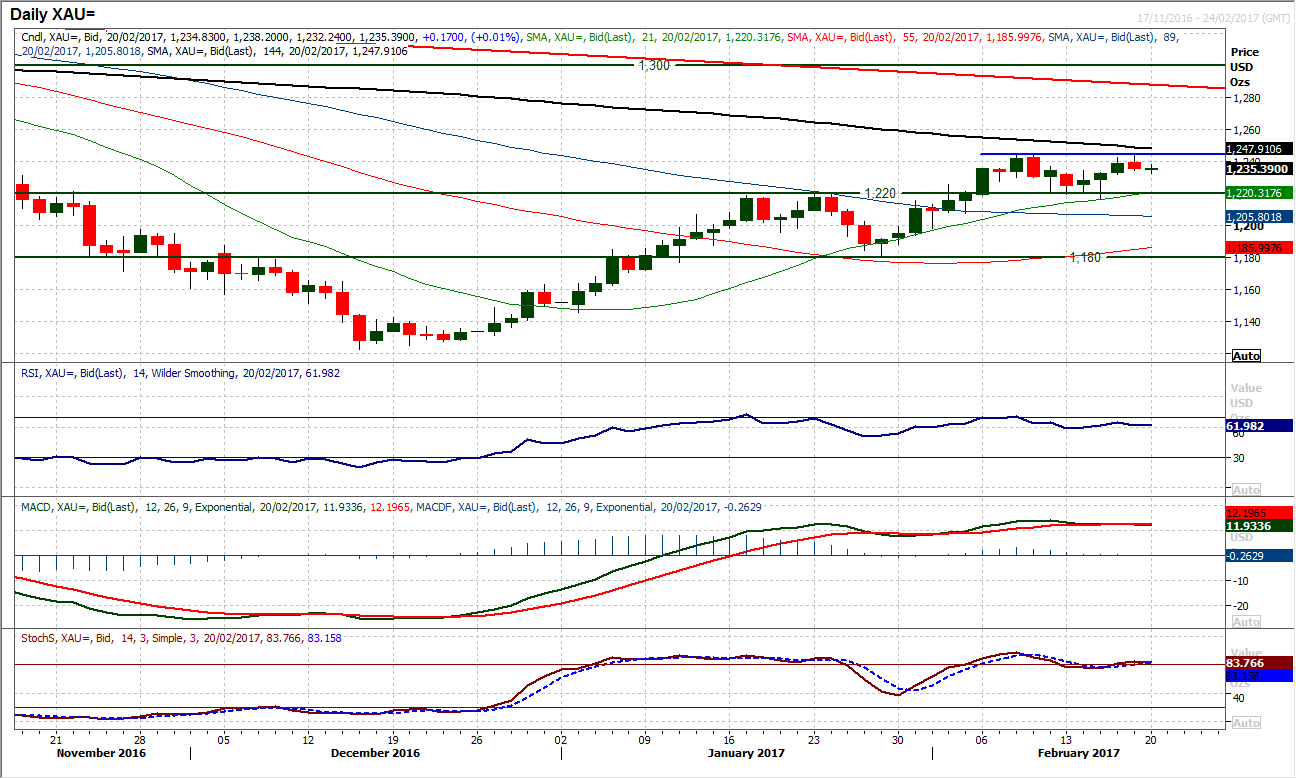
Gold
So many of the markets that price of the movement in the US dollar have become rangebound in recent days, and gold is no exception. The rally on gold could not breach the key near term resistance at $1244.70 on Friday and has subsequently started to fall over again. A minor negative candle posted on Friday has been formed but this is nothing too significant yet. The daily momentum indicators are still holding on to a positive outlook but the impetus in the bull move is beginning to wane now. The RSI is pulling back towards 60, whilst the MACD lines have plateaued in recent days, has have the Stochastics. The hourly chat shows a move back below the near term pivot at $1236 this morning will be a disappointment for the bulls, with the hourly RSI now oscillating between 30/70. A move back below minor support at $1231.60 would re-open $1220 again. Closing back above $1236 would be an improvement again but the resistance is growing around $1244.
WTI Oil
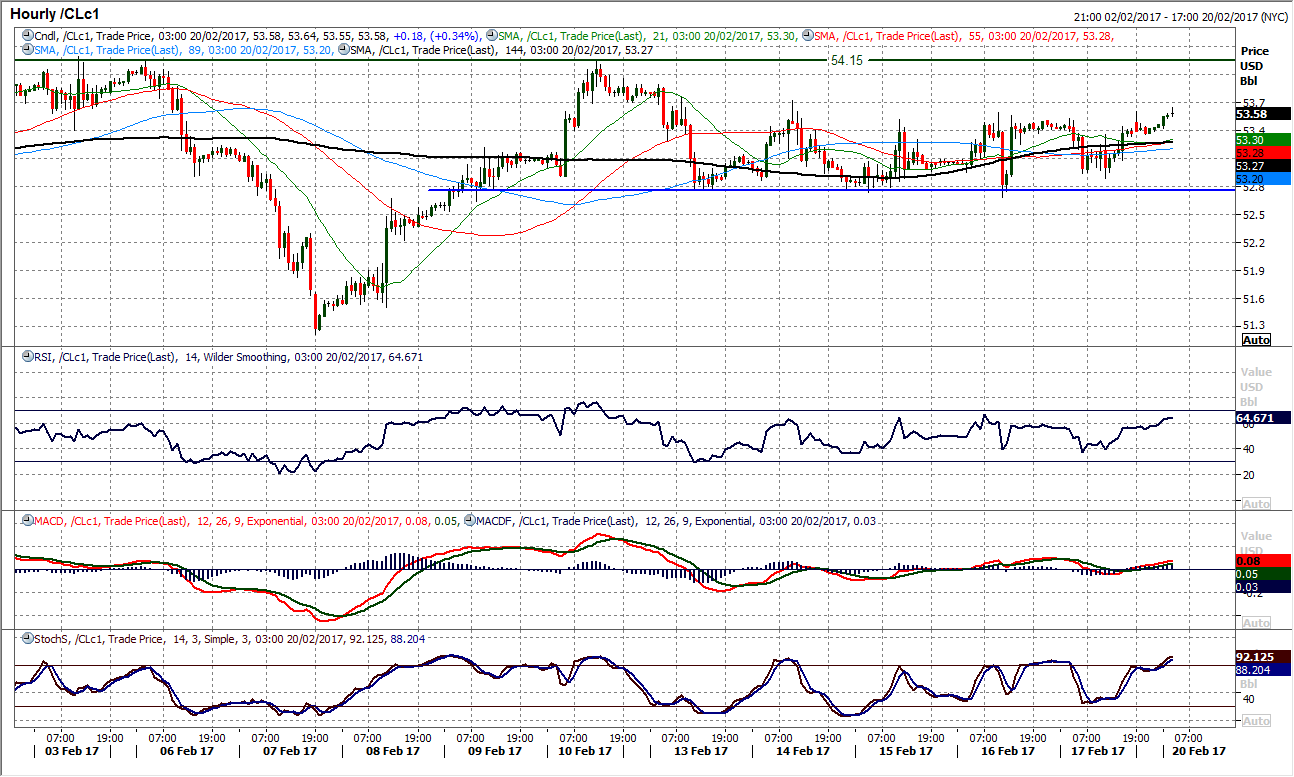
The consolidation on oil continues and I could almost do a copy and paste of Friday’s comment, except for the posting of a neutral candle that resulted in close that was nearly entirely flat on the day. The last week has seen the market increasingly benign and the converging trend lines within the two month trading range are increasingly tight, today come in at $51.90/$53.80. Furthermore, the Bollinger Bands are increasingly narrow too with less than $2 between them. Narrow Bollinger Bands tend to be seen before a major breakout, so despite the benign market, could this be the approach to the next big move? The support at $52.70 remained intact throughout last week, with resistance at $53.70. The old pivot at $52.00 would come back into play on a support breach, but with the medium to longer term signals still positively configured, corrections are still likely to be bought into. Resistance is $54.15 and $54.35, under the $55.25 key high.
Author

Richard Perry
Independent Analyst


