Dollar continues to extend declines for the third consecutive day

EUR/USD at Risk Of A Correction As The Rally Continues
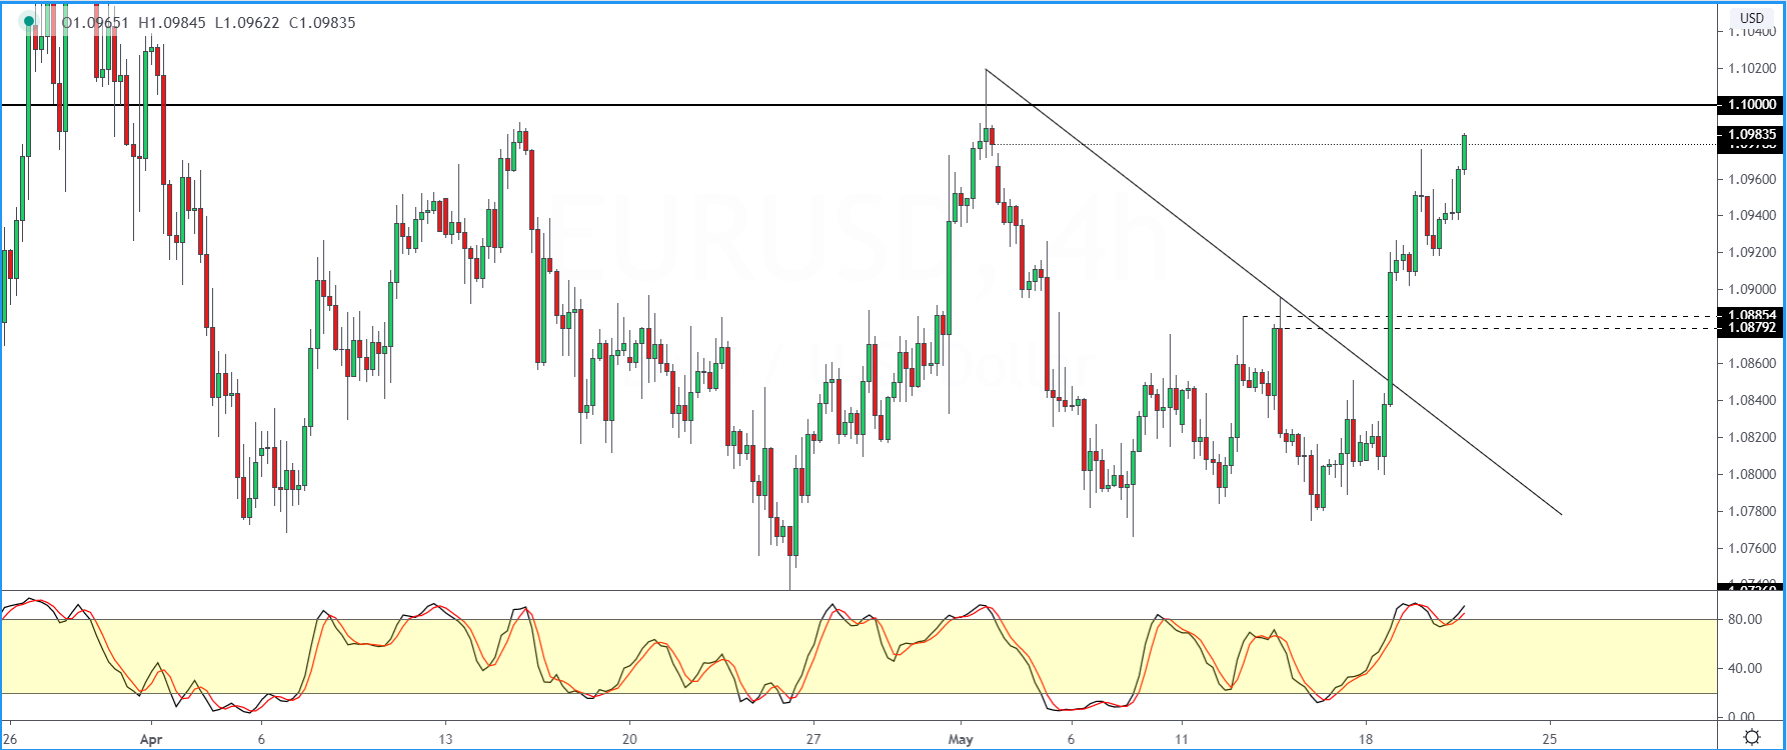
The euro currency is rising steadily, with a boost from a weaker US dollar.
Price action is, however, indicative that a correction could come in the near term.
At the time of writing, EURUSD is seen filling the gap from May 1 st , 2020. The Stochastics oscillator is pointing to a hidden divergence.
This, along with the fact that the price level near 1.0885 – 1.0879 is not yet tested for support suggests a move lower.
A breakdown in the rally could see this level being tested once again. This is as long as EURUSD does not break past the 1.1000 level.
GBPUSD Could Struggle To Breakout Above 1.2271
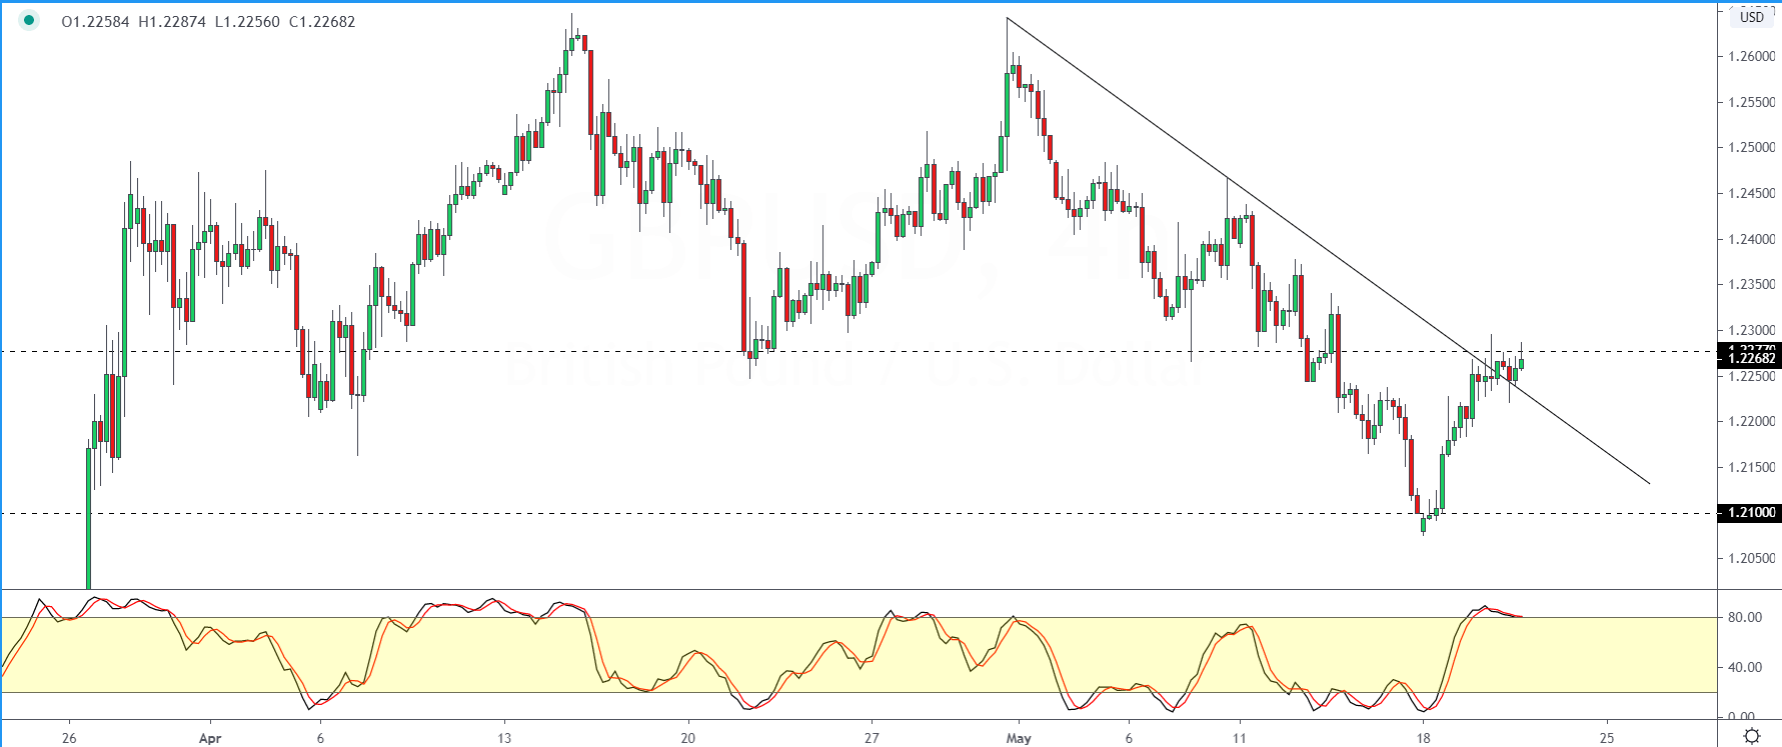
GBPUSD is maintaining a steady pace as the recent rally has pushed price to the technical resistance area of 1.2271.
The strong hidden divergence on the Stochastics points to a possible correction lower.
Given that GBPUSD has formed a bottom near 1.2100, this could be the downside in the currency pair.
But, we expect price action to remain range-bound within 1.2271 and 1.2100 in the short term.
Any breakout above 1.2271 will, of course, need to see a higher low forming above this level to validate any further upside gains.
WTI Crude Oil Rallies To Resistance Level
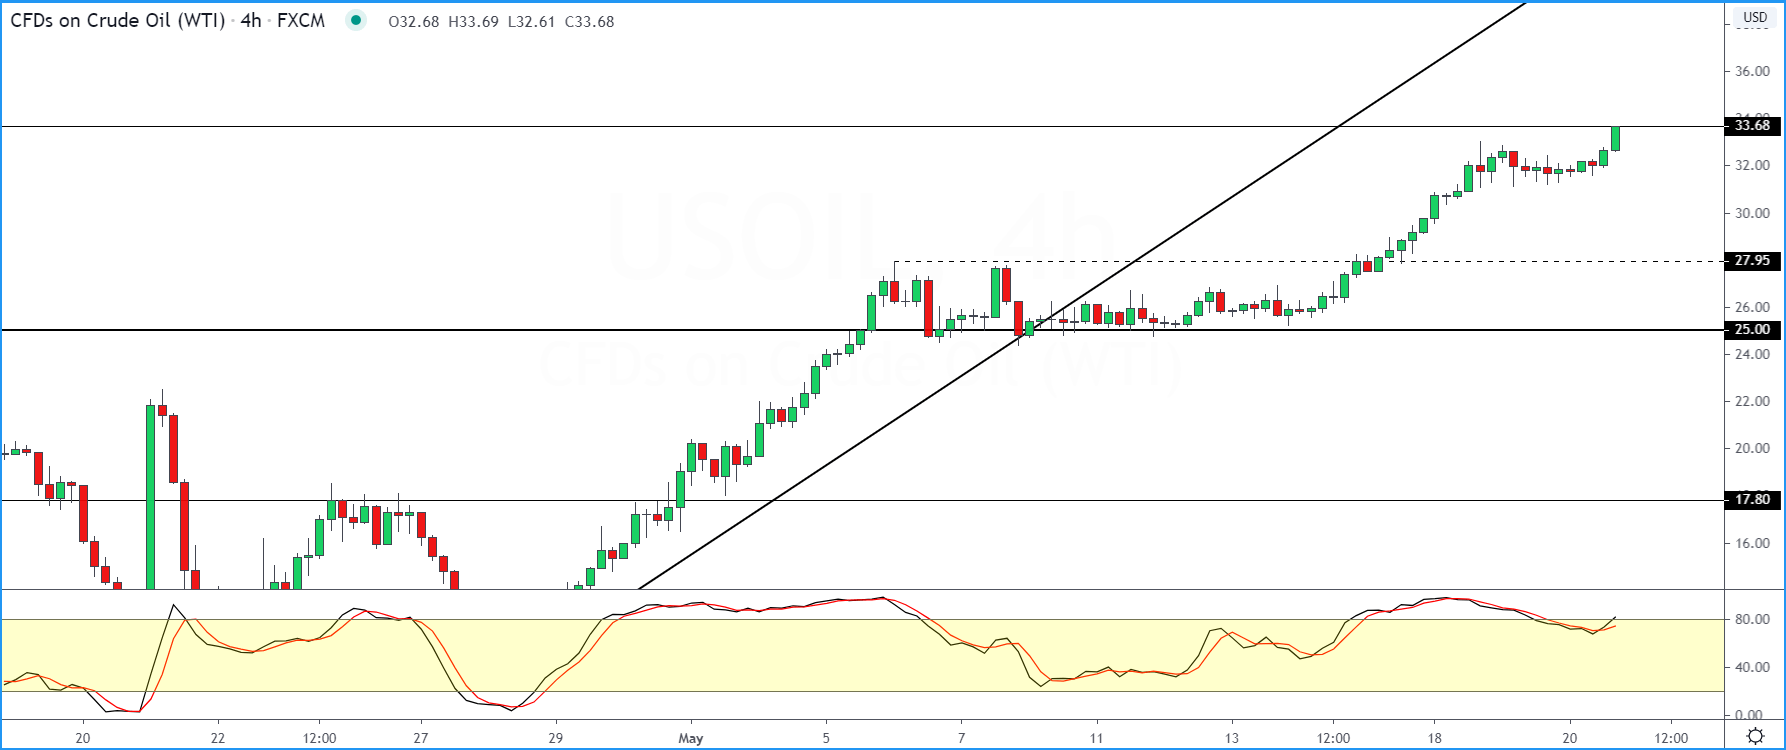
The rally in oil prices saw the commodity finally hitting the technical resistance level at 33.59.
This comes as the commodity rose over 5% intraday on Wednesday.
But with the Stochastics oscillator indicating a possible divergence, we could see a correction.
Of course, if oil prices rise convincingly above the 33.59 resistance level, this downside view will be invalidated.
To the downside, oil prices could test the lower price area near 27.95 if the correction gets underway and oil starts to drift lower.
XAU/USD Attempts To Pare Losses
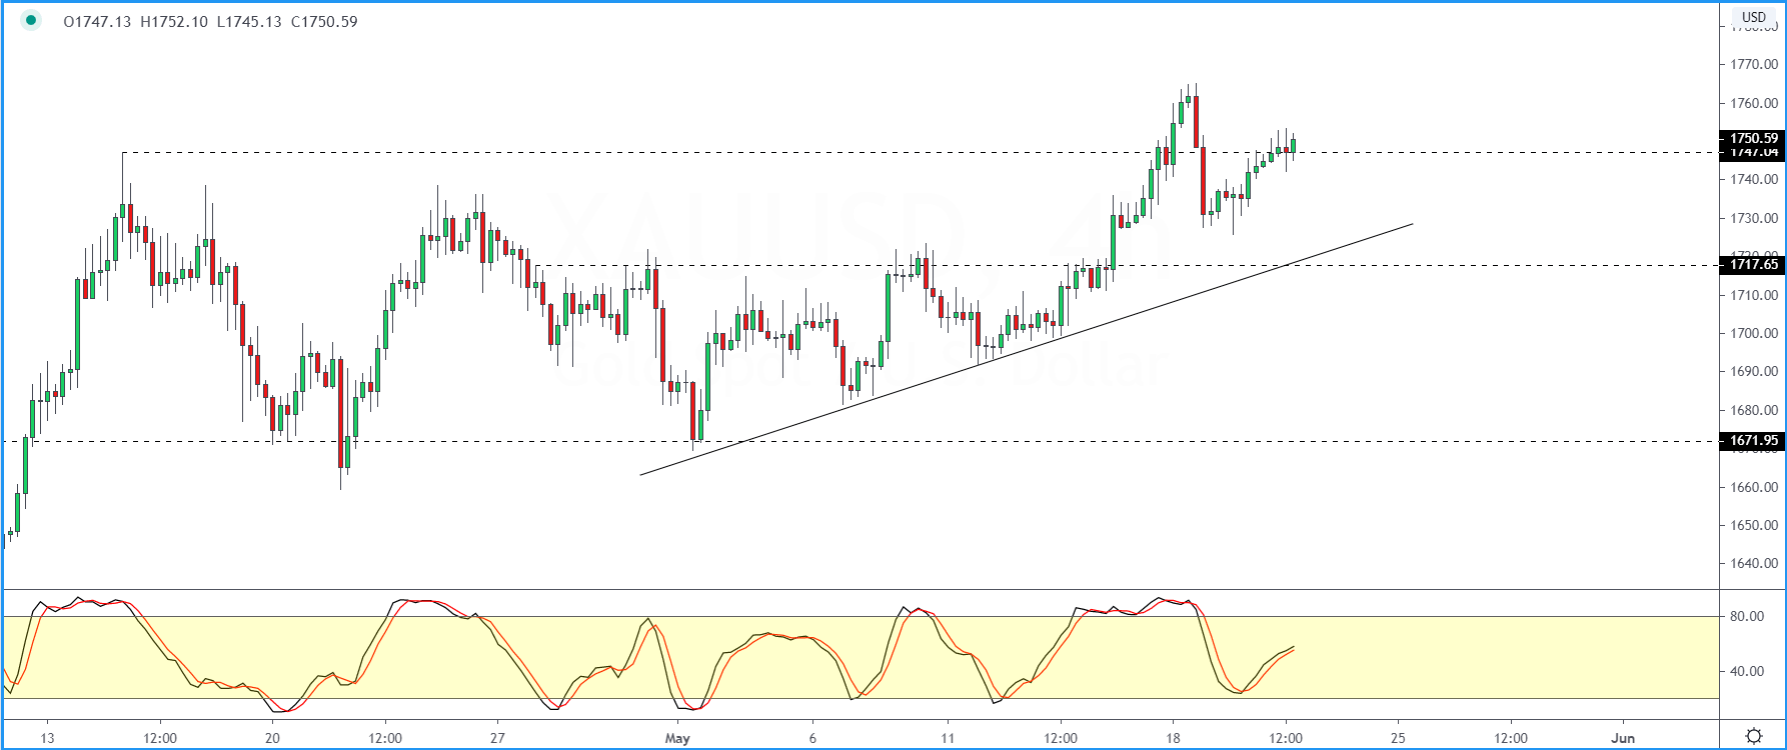
The precious metal is posting a recovery rally following the sell-off from the previous sessions.
Price action is back trading near the 1750 handle after slipping to lows of 1731 earlier.
But with the previous high at 1764.90 level, the upside could be capped.
This is, of course, unless price action breaks past this level to post new highs. If a lower high forms as a result, then expect a move lower.
The previous lows at 1731 will be the initial target followed by a move toward the 1717.65 level which could be tested for support.
Author

John Benjamin
Orbex
John is a market analyst for Orbex Ltd. and is a forex and equities trader having been involved in trading since late 2009. John makes use of a mix of technical and fundamental analysis and inter-market relationships.


