Does CoT Show Battle over Gold?

The Commodity Futures Trading Commission has released the latest CoT report. What can we learn from it about the gold market?
Light and Darkness in the Gold Market
The epic battle between good and evil. The conflict between light and darkness. We and them. This is how some analysts portray the Commitments of Traders report. Commercials, i.e. bullion banks such as JP Morgan, are of course the bad guys.
But wait, what's all this about? As we explained in our Dictionary, the Commitments of Traders Report, also known as the CoT or COT report, is one of the most widely analyzed publications in the U.S. futures market, including the gold market. It provides investors with a breakdown of open interest positions (i.e., the total number of futures contracts not yet liquidated by an offsetting transaction or fulfilled by delivery) of all major contracts that have more than 20 traders. It is a valuable publication. However, this weekly report contains Tuesday's data, but it is issued on Friday with a three day lag. Let's analyze now the most recent publication.
Gold Positions as of January 9, 2018
The chart below shows the gold futures and options combined traded at Comex. It indicates that non-commercials (speculators) were net long and tended to follow gold prices, while commercials were net short and generally moved in the opposite direction to the gold prices.
Chart 1: Gold prices (yellow line, right axis, London P.M. fixing, in $), the net position of commercials (green line, left axis) and the net position of non-commercials (red line, left axis) over the last 12 months (aggregate version, futures and options combined).
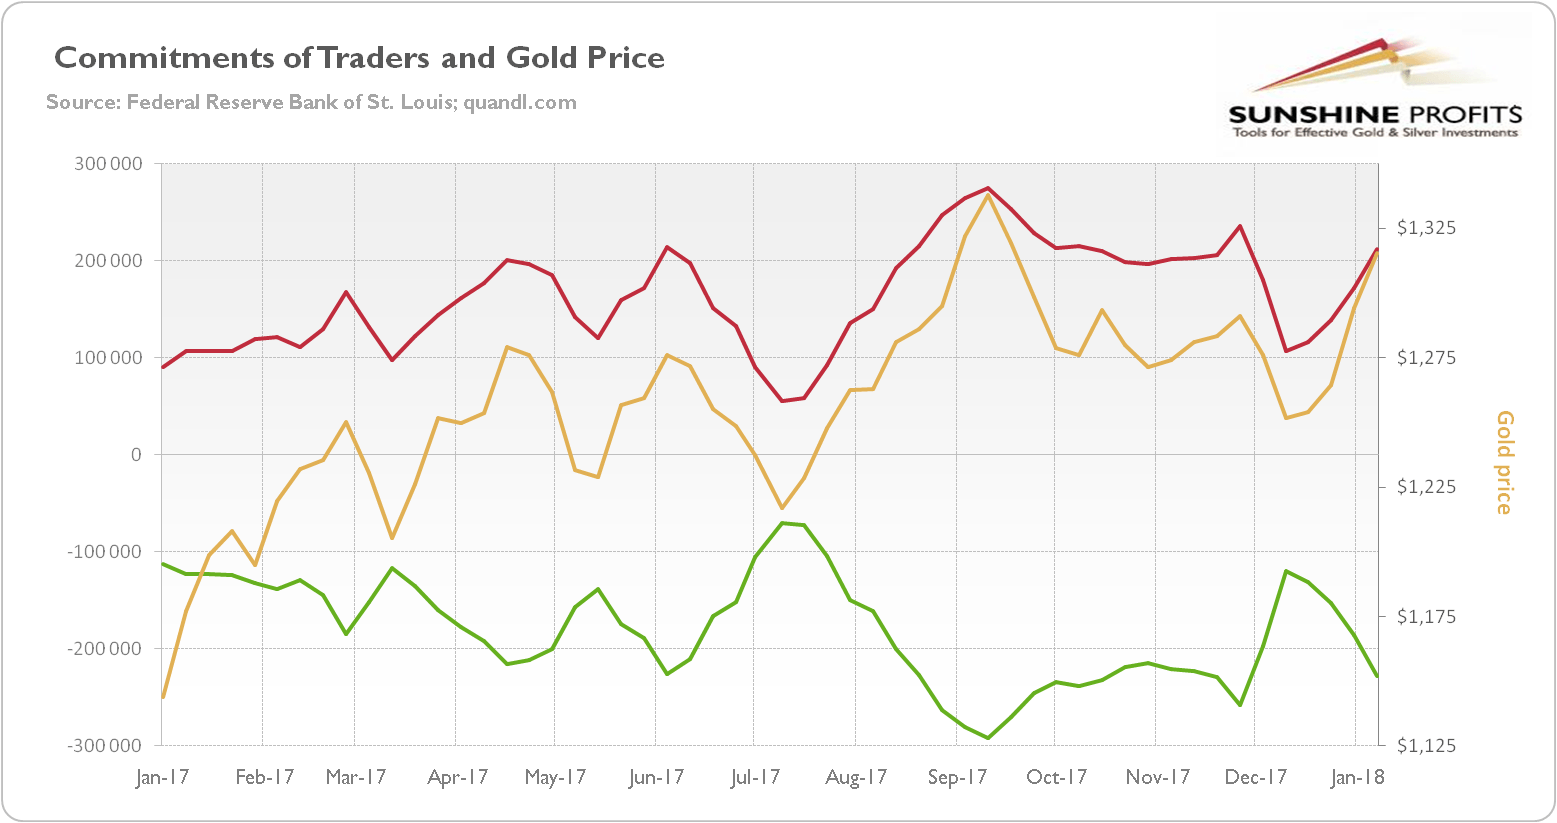
It makes perfect sense, as the commercials' position is effectively just the mathematical offset of the non-commercials' position. Both players are like two sides of the coin. Speculators cannot be net long, unless commercial go net short. Yin and yang.
As you can see in the chart, non-commercials drive the process, as their net position usually moves in the same direction as the gold prices. So investors can use this data as a sentiment indicator in the gold market (but using it as a timing indicator and detecting if the market is too bullish or too bearish, is a different matter). Both of them started to decline in September, but they rebounded in December and continued rally in January. At the same time, commercials strengthened their net short position. We see that the current positions are within historical limits, i.e. in September they were higher. Hence, the current trend has still some room to persist. In other words, if market sentiment does not change, the gold price rally will continue.
Conclusion
The latest Commitment of Traders (COT) report showed another rise in speculative net long position for the fourth straight week. They increased by 40,000 contracts from the previous week, which is quite impressive, but not unusual. And it's not a very long series of increases and there is still a long way to the all-time net-long position high of 348,000 contracts achieved in July 2016. Hence, the rally in gold prices may continue for a while, especially if the weakness in the U.S. dollar persists. Having said this, investors should remember that the net positions are able to change quickly – especially that the report comes out with the lag. The CoT report is thus a sentiment indicator, which can picture the market' attitude, but it shouldn't be used as a timing indicator. Last but not least, there are many analysis which suggest that commercials manipulate the gold market, as they are almost all the time net short. Well, it may be the case (some conspiracy theories proved to be correct after some time) – but investors should remember that trade has always two sides. Speculators cannot be long, if commercials don't take short positions. Yin and yang.
Want free follow-ups to the above article and details not available to 99%+ investors? Sign up to our free newsletter today!
Author

Arkadiusz Sieroń
Sunshine Profits
Arkadiusz Sieroń received his Ph.D. in economics in 2016 (his doctoral thesis was about Cantillon effects), and has been an assistant professor at the Institute of Economic Sciences at the University of Wrocław since 2017.


