|

DJIA: Technical Analysis

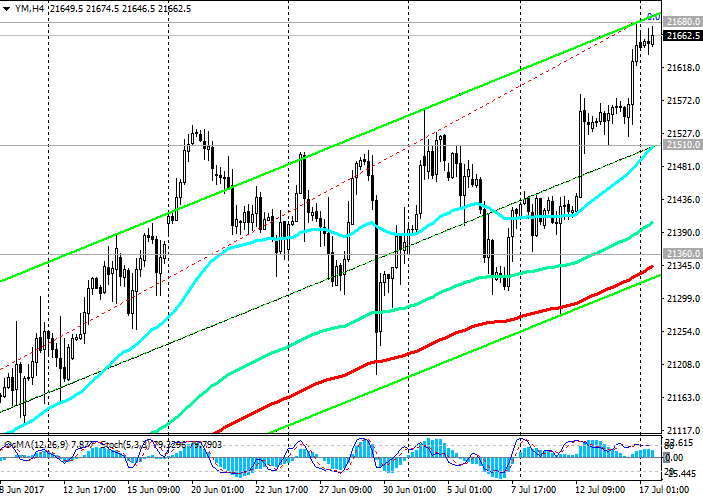
DJIA updated its annual highs on Friday and reached a new absolute maximum near the mark of 21680.0. The DJIA index continues to grow steadily, starting from February 2016 and trading in the ascending channels on the daily and weekly charts.

So far, the index is trading above the key support level of 20300.0 (EMA200 on the daily chart, as well as the Fibonacci level of 23.6% correction to the growth in the wave from the level of 15660.0 after rebounding in February this year to the collapse of the markets since the beginning of the year. The maximum of this wave and the Fibonacci level 0% is near the mark of 21536.0), its medium-term positive dynamics is preserved. The long positions in the DJIA index trade are relevant.

Against the background of low inflation in the US and the Fed's predilection, in connection with this, to a cautious approach in the matter of further interest rate hikes, the further growth of the DJIA index is likely.

Only in case of breakdown of the support level of 21360.0 (EMA200 on the 4-hour chart) can we again return to consideration of short positions on the DJIA index. And only in case of breakdown of the support level of 19380.0 (Fibonacci level of 38.2%) can we speak about the breakdown of the bullish trend.

Support levels: 21510.0, 21360.0, 21100.0, 20600.0, 20300.0

Resistance levels: 21680.0, 22000.0

YM

Trading Scenarios

Buy Stop 21690.0. Stop-Loss 21500.0. Take-Profit 21700.0, 21800.0, 22000.0

Sell ​​Stop 21500.0. Stop-Loss 21690.0. Take-Profit 21360.0, 21100.0, 21000.0, 20600.0

YM

Author

Yuri Papshev

Yuri Papshev

Independent Analyst

Independent trader and analyst at Forex market. Trade experience - more than 10 years. In trade Yuri Papshev uses a combination of fundamental and technical analysis.

More from Yuri Papshev
Share:

Editor's Picks

EUR/USD hits two-day highs near 1.1820

EUR/USD picks up pace and reaches two-day tops around 1.1820 at the end of the week. The pair’s move higher comes on the back of renewed weakness in the US Dollar amid growing talk that the Fed could deliver an interest rate cut as early as March. On the docket, the flash US Consumer Sentiment improves to 57.3 in February.

GBP/USD reclaims 1.3600 and above

GBP/USD reverses two straight days of losses, surpassing the key 1.3600 yardstick on Friday. Cable’s rebound comes as the Greenback slips away from two-week highs in response to some profit-taking mood and speculation of Fed rate cuts. In addition, hawkish comments from the BoE’s Pill are also collaborating with the quid’s improvement.

Gold climbs further, focus is back to 45,000

Gold regains upside traction and surpasses the $4,900 mark per troy ounce at the end of the week, shifting its attention to the critical $5,000 region. The move reflects a shift in risk sentiment, driving flows back towards traditional safe haven assets and supporting the yellow metal.

Crypto Today: Bitcoin, Ethereum, XRP rebound amid risk-off, $2.6 billion liquidation wave

Bitcoin edges up above $65,000 at the time of writing on Friday, as dust from the recent macro-triggered sell-off settles. The leading altcoin, Ethereum, hovers above $1,900, but resistance at $2,000 caps the upside. Meanwhile, Ripple has recorded the largest intraday jump among the three assets, up over 10% to $1.35.

Three scenarios for Japanese Yen ahead of snap election

The latest polls point to a dominant win for the ruling bloc at the upcoming Japanese snap election. The larger Sanae Takaichi’s mandate, the more investors fear faster implementation of tax cuts and spending plans. 

XRP rally extends as modest ETF inflows support recovery

Ripple is accelerating its recovery, trading above $1.36 at the time of writing on Friday, as investors adjust their positions following a turbulent week in the broader crypto market. The remittance token is up over 21% from its intraday low of $1.12.