Despite yield curve inversion, can a rebound on sentiment last?

Market Overview
All the chatter has been of yield curve inversions in the past few sessions. The UK curve inverted earlier this week and traders have been pricing for the implications of inversion on the US yield curve. The Federal Reserve reportedly looks at the 3 month/10 year spread (which has been inverted for months), but apparently markets are all in a tiz now because the 2 year/10 year spread has just become inverted. Although the Fed sees the 3 month/10 year spread as being the more pertinent indicator to watch as potential harbinger for approaching recession, markets have reacted to this latest bit of bad news for sentiment. The truth is that bond markets have been making their moves for months and the warnings signs have been growing for weeks, putting the squeeze on sentiment. Yesterday’s inversion of the 2 year/10 year spread seemed to have been another trigger point. Equities fell sharply last night, with Wall Street around -3% lower. Safe haven plays such as gold and in major currencies (yen and Swissy) also remain favourable. However, as the European session takes over there has been another shift in sentiment as gold and the yen unwind yesterday’s gains and equity futures rebound. What has tended to be a theme of recent sessions is that attempted recoveries fall short and selling resumes quickly. Near term strength in higher yielding (and therefore most at risk of tightening yield differentials) currencies is seen as a chance to sell, so this morning’s rally on Aussie will be eyed. Australian unemployment was in line at 5.2% (5.2% exp, 5.2% last), but with an improvement in participation rate to 66.1% (66.0% expected, 66.0%), the Aussies has picked up this morning, but will it last?

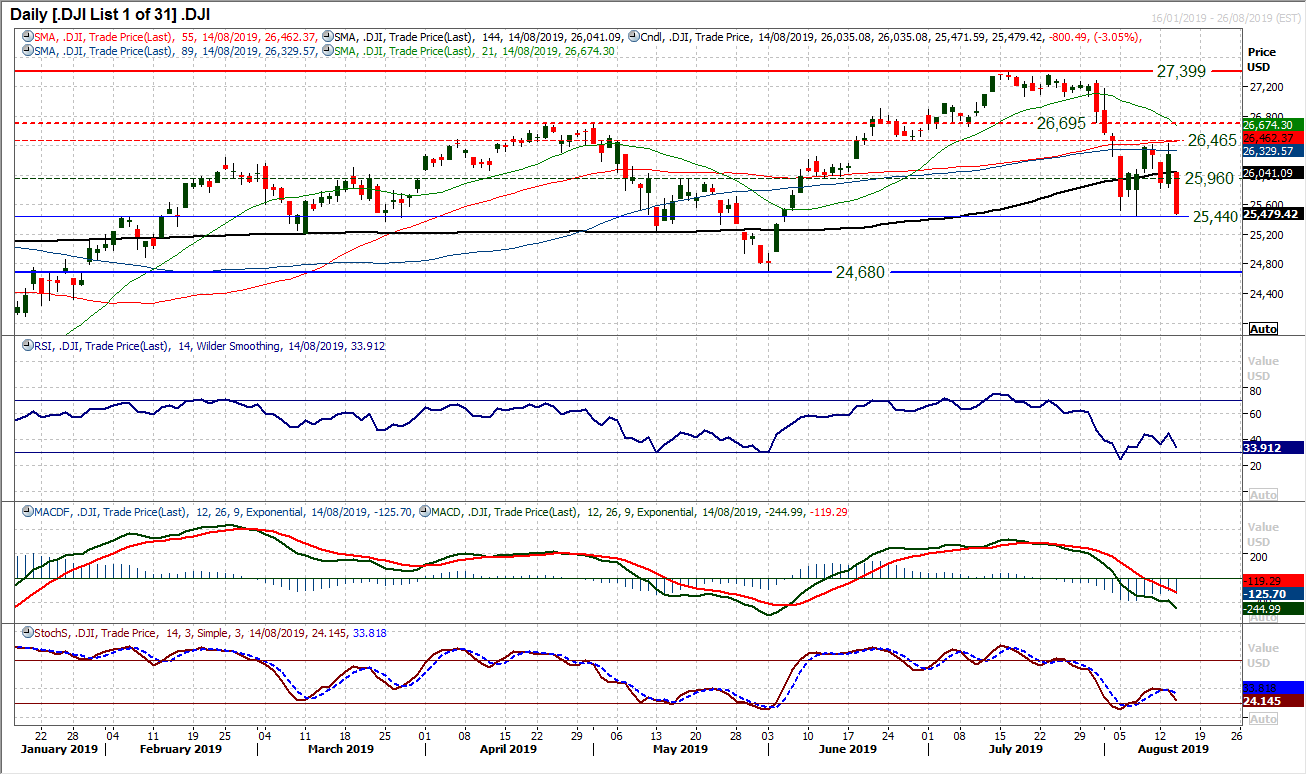
Wall Street closed with huge losses as the Dow lost -800 ticks (fourth biggest session tick loss ever)and the S&P 500 closed -2.9% at 2840. US futures have rebounded to pare some of yesterday’s losses with gains of around +0.5% this morning. Asian markets have had a bit of a wild ride today, opening sharply lower before rallying into the close, with the Nikkei -1.2% and the Shanghai Composite +0.2%. In Europe, markets are pointing higher, with FTSE futures +0.3% and DAX futures +0.5%. In forex, there is weakness on JPY and strength in the AUD. In a theme of counter trend moves, there is also a minor bounce on EUR and GBP. In commodities, early gains on gold have dissipated and the market is trading around $5 lower again. Oil is trading around flat on the day.
UK Retail Sales are the main focus on the economic calendar for the European session. Announced at 0930BST, ex-fuel sales are expected to slip by -0.2% in the month of July (after a rise of +0.9% in June), which would pull the year on year growth back to +2.3% (from +3.6%). New York Fed (Empire State) Manufacturing at 1330BST is expected to drop back to +3.0 in August (from +4.3 in July). US Industrial Production is at 1415BST which is expected to see monthly performance showing the most marginal of growth of +0.1% in July (0.0% in June), with Capacity Utilization a slight drop back to 77.8% (from 77.9%).
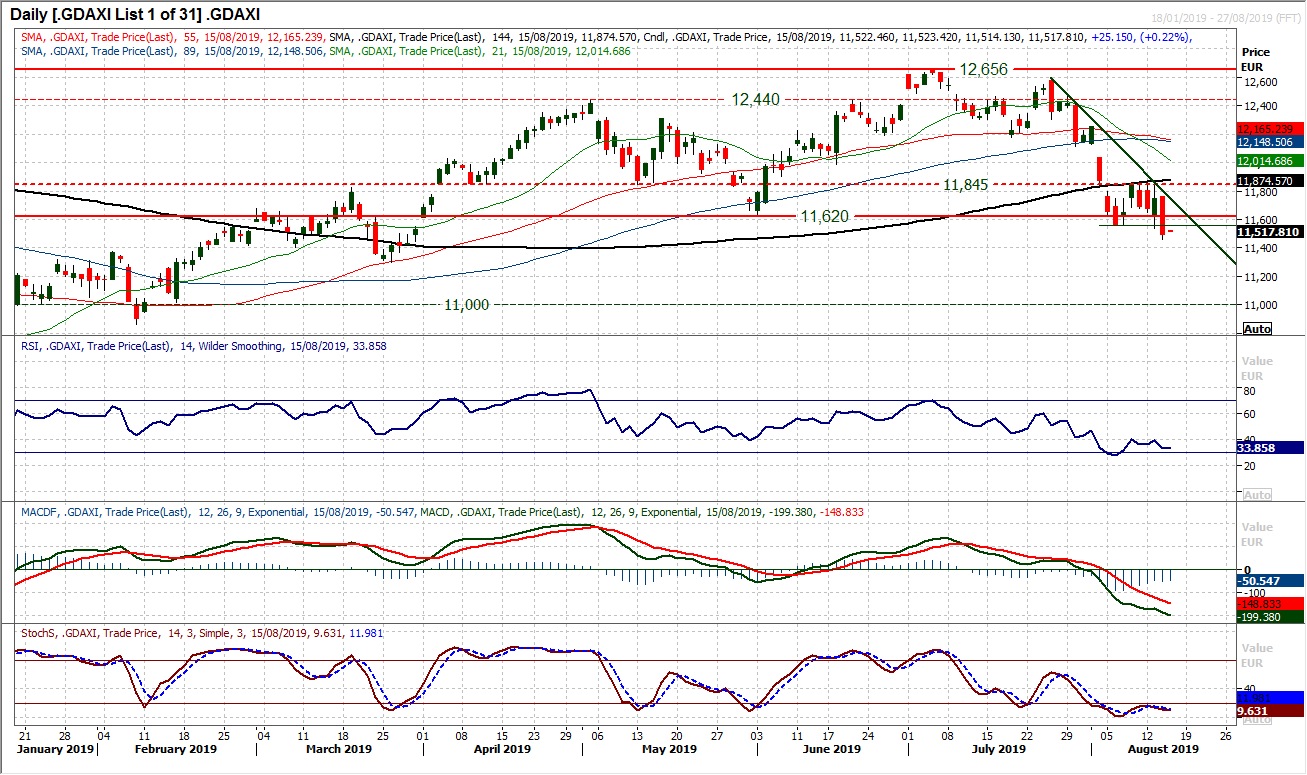
Chart of the Day – DAX Xetra
In the wake of the huge selling pressure of early August that breached the key June low of 11,620, the market attempted to form a recovery. However an old pivot has been a barrier to gains and form a resistance between 11,845/11,865 throughout the last week. Now, with a hugely negative session and a closing decline of over 2%, the DAX has closed back decisively under 11,620 again at a four and a half month low. The outlook is becoming increasingly concerning now for the DAX. For weeks now rallies are consistently being seen as a chance to sell. The importance of the 11,845/11,865 resistance band has increased significantly following the breach of support. There is now a band of initial overhead supply 11,560/11,620. Momentum indicators on the daily chart are deteriorating in bearish configuration, with RSI showing downside potential, MACD lines accelerating lower and Stochastics negatively configured. The hourly chart shows intraday rallies are struggling now, with 50/60 on hourly RSI an area where the bears regain control, whilst the hourly MACD lines are consistently failing at neutral. The next support is not until 11,312 which is the key March low.
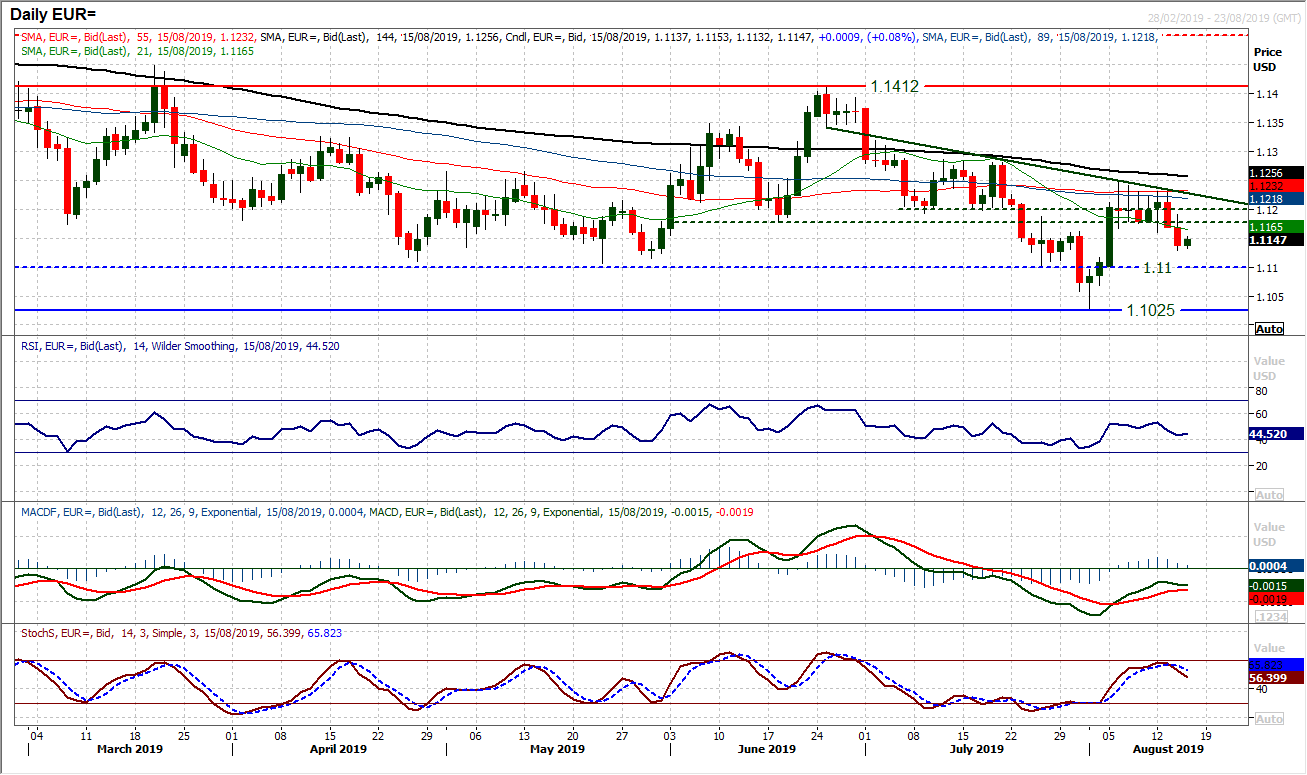
EUR/USD
After a five day period of consolidation, a couple of bear candles are now opening the downside once more. Losing back under the old pivot band $1.1180/$1.1200 on Tuesday, followed by another negative candle yesterday, the negative pressure is growing one more. This is reflected in the Stochastics crossing lower again and the RSI back under 50. However, there is still a messy near to medium term outlook on EUR/USD. Although the old support at $1.1100 is open, this does not look like a straight line move. How the market responds to today’s early move higher will be key. The $1.1180/$1.1200 pivot band is now a basis of resistance overhead. On the hourly chart there is a mild negative bias that has formed, with hourly RSI failing around 60 and MACD lines below neutral. A minor area of overhead supply $1.1160/$1.1165 could be restrictive today. Initial support at $1.1130.
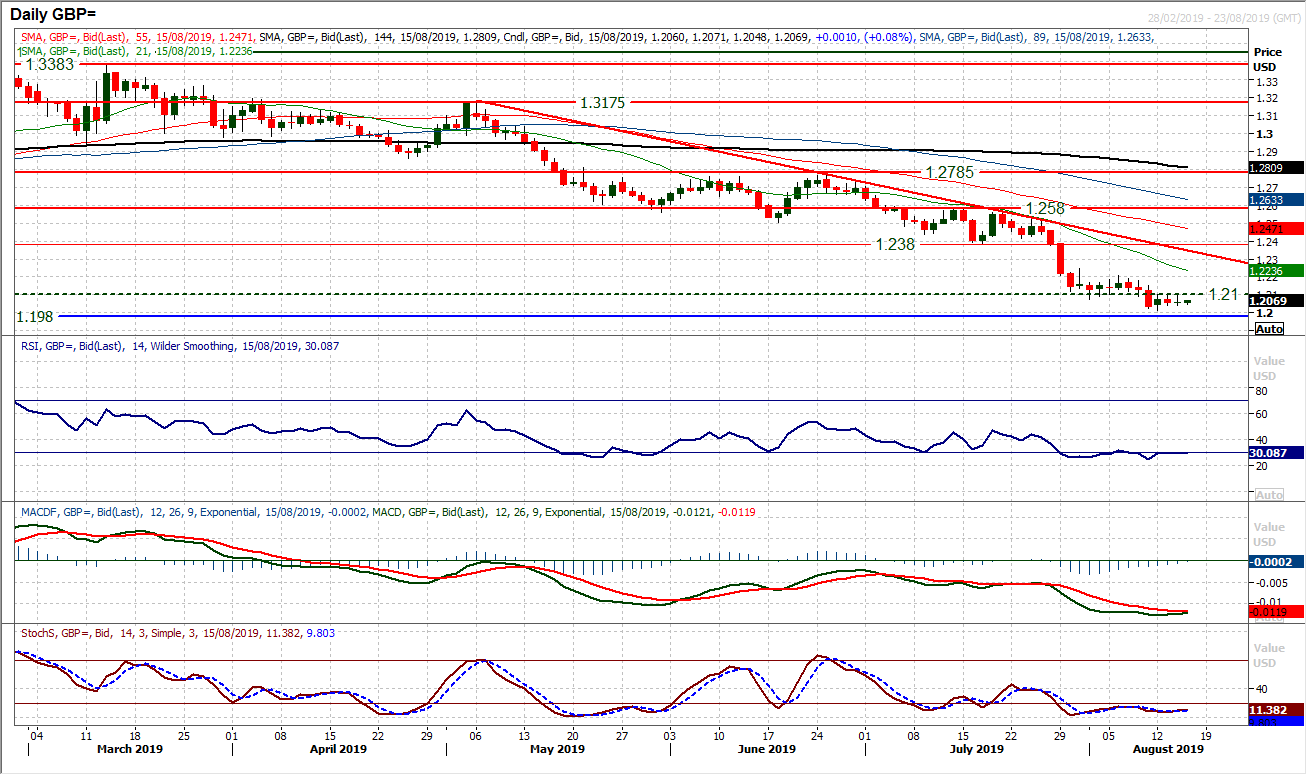
GBP/USD
Cable looks to be in a very subdued phase of trading. An old floor of $1.2100 was breached last week and has become an area of initial overhead supply to be resistance as the market seems to be drifting lower. There is precious little for the bulls to be excited about and the outlook remains negative from all aspects. Having broken $1.2100 this means that $1.1980 is open, whilst this week’s low at $1.2013 is the initial support. The only caveat to the continued downside is that the market is so short that it would not take much to drive a big technical (short covering) rally. For that reason, $1.2000 needs to be kept in mind being such a massive psychological level. Resistance at $1.2100, then $1.2210 and $1.2250.
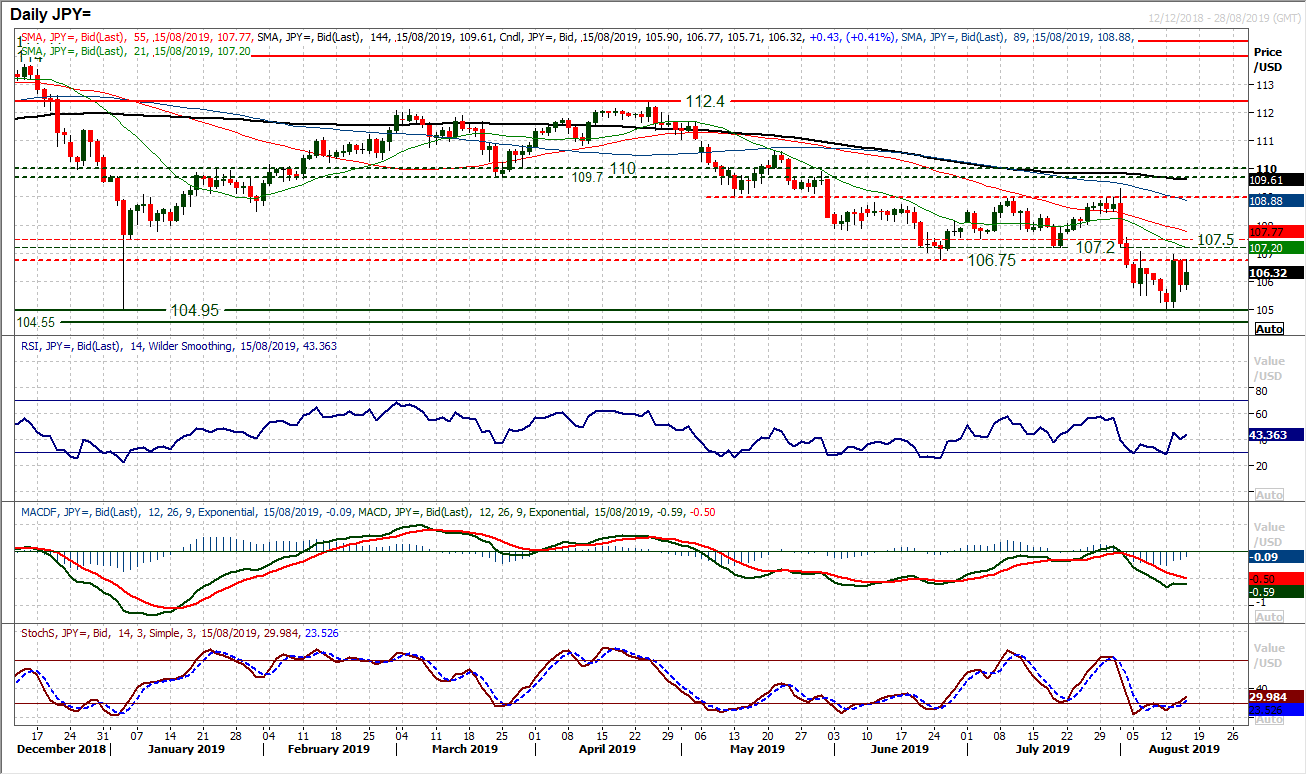
USD/JPY
Price action of the past couple of weeks shows that rallies continue to be seen as a chance to sell. Following the original breakdown of the 106.75 support a couple of weeks ago, the kick back rally failed at 107.07 before the market then resumed the bearish drift. The overhead supply of all the old June/July lows between 106.75/107.50 proved too much for the bulls. Tuesday’s huge positive recovery candle of almost 150 pips has again been unable to sustain traction and the rally has fallen over, resulting in yesterday’s -85 pip close lower. Once again the overhead supply between 106.75/107.50 has put paid to the recovery. A renewed retreat back to test the support band 104.50/105.00 (the latter being Monday’s low) should be expected again. Momentum indicators are negatively configured and suggest that rallies remain a chance to sell. An initial consolidation early today, but there is still a negative bias.
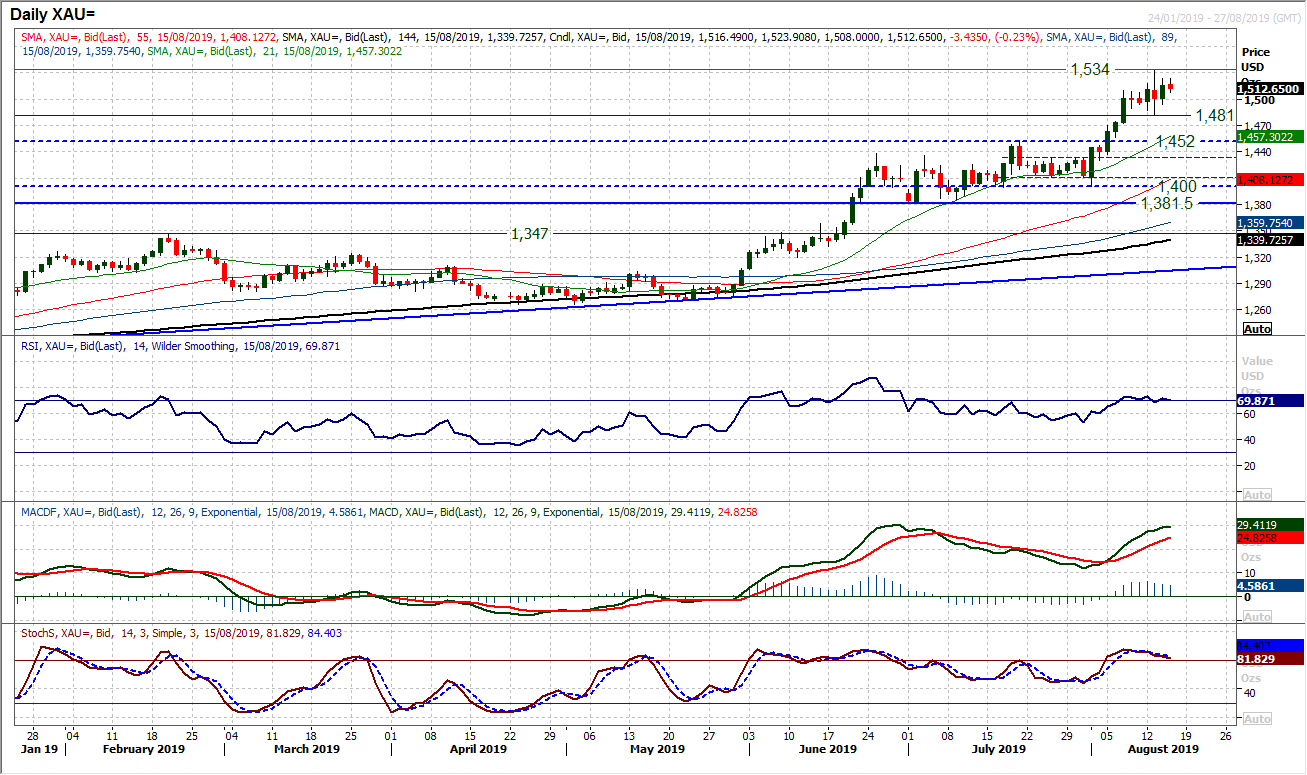
Gold
Recent sessions have been filled with questions about whether the bulls will continue to pull higher. The higher than expected US inflation on Tuesday played a role in pulling gold lower by almost $50 in just four hours, however there still seems to be an underlying appetite to buy. The market has since looked to stabilise from this low at $1481 and is building solidly higher again. Yesterday’s close at $1516 was a multi-year closing high and the market is edging higher again. However, there are still questions surrounding how much higher this bull run can go without a correction. Tuesday’s volatility should be seen as a warning that the market can turn very quickly. Momentum looks positive, but the Stochastics are drifting lower as the market rises (warning of exhaustion) and RSi is extended around 70. Resistance from Tuesday’s high is at $1534.
WTI Oil
Periods of near term recovery on oi continue to be seen as a chance to sell. In the past four months of trending lower, the rallies have been failing at lower levels. The July rally peaked at $58.50 whilst the latest rally has stumbled a shade below $57.50. This potential failure (coming with a decisive negative close) comes as the RSI has fallen over again above 50, whilst Stochastics and MACD lines threaten bear crosses. Initial support is around $54.00 today and a close below would certainly suggest the sellers are regaining momentum again. Below $53.60 re-opens the key medium to long term support around $50.00/$50.50.

Dow Jones Industrial Average
A massive sell-off on Wall Street as the Dow has plunged 800 ticks and the bulls take another huge blow. Closing at the lowest since 4th June, the Dow is increasingly corrective. This has been a particularly volatile phase of trading on Wall Street in the past couple of weeks. However, yesterday’s move once more ramps up the pressure for further downside. Futures are ticking mildly higher at the open today and how the market responds to this will be key. A quick bull failure would once more put pressure on support at 25,440 support. This is the August intraday low and a closing breach would put the Dow on course for further retreat towards the key June low at 24,680. Momentum indicators are the concern which show rallies are seen as a chance to sell. The bear cross on Stochastics after struggling up to 40, whilst the MACD lines are once more accelerating lower and the RSI still has downside potential in the low 30s. There is resistance in the band 25,825/25,960 initially.
Author

Richard Perry
Independent Analyst


