Dem wins doesn’t move markets [Video]
![Dem wins doesn’t move markets [Video]](https://editorial.fxstreet.com/images/Markets/Currencies/Majors/DollarIndex/financial-planning-calculator-closeup-1775995_XtraLarge.jpg)
US Dollar: Sep '22 USD is Down at 106.010.
Energies: Aug '22 Crude is Down at 89.74.
Financials: The Sep '22 30 Year bond is Up 16 ticks and trading at 142.28.
Indices: The Sep '22 S&P 500 emini ES contract is 38 ticks Higher and trading at 4134.00.
Gold: The Dec'22 Gold contract is trading Down at 1809.90. Gold is 24 ticks Lower than its close.
Initial conclusion
This is not a correlated market. The dollar is Down, and Crude is Down which is not normal, but the 30-year Bond is trading Higher. The Financials should always correlate with the US dollar such that if the dollar is lower, then the bonds should follow and vice-versa. The S&P is Higher, and Crude is trading Lower which is correlated. Gold is trading Lower which is not correlated with the US dollar trading Down. I tend to believe that Gold has an inverse relationship with the US Dollar as when the US Dollar is down, Gold tends to rise in value and vice-versa. Think of it as a seesaw, when one is up the other should be down. I point this out to you to make you aware that when we don't have a correlated market, it means something is wrong. As traders you need to be aware of this and proceed with your eyes wide open. Asia is trading Lower with the exception of the Singapore exchange which is Higher. Currently Europe is trading Higher with the exception of the London and Paris exchanges which are Lower.
Possible challenges to traders today
-
CPI is out at 8:30 AM EST. This is Major.
-
Core CPI is out at 8:30 AM EST. This is Major.
-
Final Wholesale Inventories is out at 10 AM EST. Major.
-
Crude Oil Inventories is out at 10:30 AM EST. Major.
-
10-y Bond Auction starts at 1 PM EST. This is Major.
-
Federal Budget Balance is out at 2 PM EST. Major.
Treasuries
Traders, please note that we've changed the Bond instrument from the 30 year (ZB) to the 10 year (ZN). They work exactly the same.
We've elected to switch gears a bit and show correlation between the 10-year bond (ZN) and the S&P futures contract. The S&P contract is the Standard and Poor's, and the purpose is to show reverse correlation between the two instruments. Remember it's likened to a seesaw, when up goes up the other should go down and vice versa.
Yesterday the ZN made its move at around 11 AM EST. The ZN hit a High at around that time and the S&P moved Higher shortly thereafter. If you look at the charts below ZN gave a signal at around 11 AM EST and the S&P moved Higher at around the same time. Look at the charts below and you'll see a pattern for both assets. ZN hit a High at around 11 AM EST and the S&P was moving Higher shortly thereafter. These charts represent the newest version of MultiCharts and I've changed the timeframe to a 15-minute chart to display better. This represented a Shorting opportunity on the 10-year note, as a trader you could have netted about a dozen plus ticks per contract on this trade. Each tick is worth $15.625. Please note: the front month for the ZN is now Sep '22. The S&P contract is also Sep' 22 as well. The front months are now Sep' 22. I've changed the format to Heikin-Ashi such that it may be more apparent and visible.
Charts courtesy of MultiCharts built on an AMP platform
ZN - Sep 2022 - 08/09/22
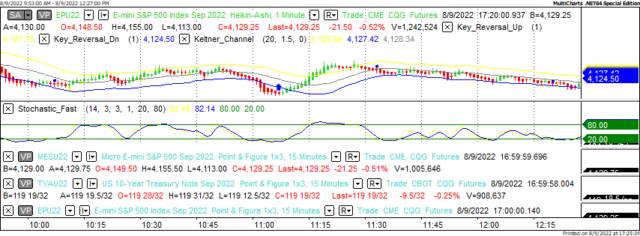
S&P - Sep 2022 - 08/09/22
Bias
Yesterday we gave the markets an Upside bias as the USD and Crude were trading Lower Tuesday morning. The markets had other ideas as the Dow traded Lower by 58 points and the other indices traded Lower as well. Today we aren't dealing with a correlated market and our bias is to the Upside.
Could this change? Of Course. Remember anything can happen in a volatile market.
Commentary
Yesterday we were all set to go Higher (or so we thought). The markets were correlated as such, but the indices had other ideas as they all slid into negative territory, It seems that the markets may be placing far too emphasis on the recent Dem wins in DC however the markets aren't buying it. Time will tell if these bills do anything for the overall economy, but thus far traders aren't buying it. Today we have CPI data and that will really move the markets today. Could this change market direction? You know it.
Author

Nick Mastrandrea
Market Tea Leaves


