Decoding market sentiment: A technical dive into US Dollar Index and Euro dynamics

Navigating the complexities of the financial markets requires a keen understanding of technical analysis. In this post, we'll dissect key charts, including the US Dollar Index, Euro Commercial Long/Short Ratios, and the EUR/USD Forex pair, to uncover potential trading signals and market sentiment. Our focus today begins with a close examination of trader positioning in the US Dollar Index.
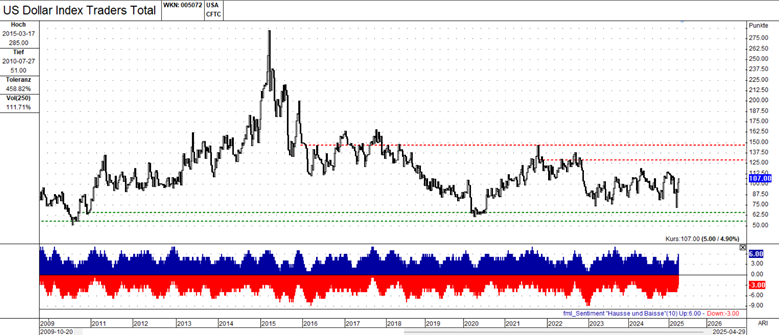
This chart offers a fascinating glimpse into the collective mindset of traders involved with the US Dollar Index. Rather than showing the price itself, it tracks the net long or short positions held by these traders over time, providing valuable insights into prevailing market sentiment.
We can observe a strong bullish trend (increasing net long positions) leading up to around March 2015, followed by a period of more neutral or range-bound positioning. More recently, since 2021, there's a potential resurgence of bullish sentiment. The current level of around 107.00 might also serve as an intermediate resistance. With a volatility of 111.71%, the positioning of US Dollar Index traders can experience substantial fluctuations, highlighting the dynamic nature of market sentiment. The sentiment indicator at the bottom suggests a slightly bullish bias overall, although with some recent bearish movement.
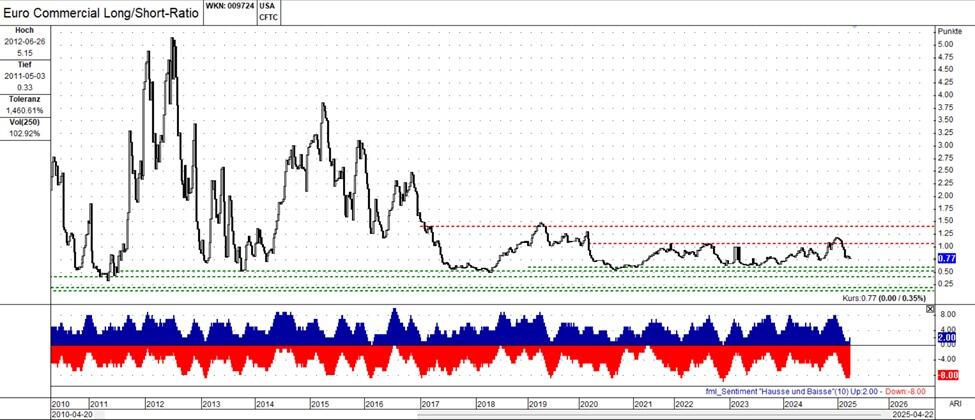
Euro commercial trader positioning: Decoding long/short ratios (Chart 2)
This chart provides a unique perspective by showing the long/short ratio of commercial traders in the Euro. Commercial traders are often seen as having a longer-term view and deep understanding of the underlying markets. A high ratio indicates they are net long (expecting the price to rise), while a low ratio suggests a net short position (expecting the price to fall). The ratio has shown significant fluctuations over time, indicating shifts in commercial traders' positioning in the Euro. These changes can offer clues about potential future price movements. The current ratio of around 0.77 suggests that, on balance, commercial traders are positioned slightly bearishly on the Euro. However, a ratio close to 1 would indicate a more neutral stance.
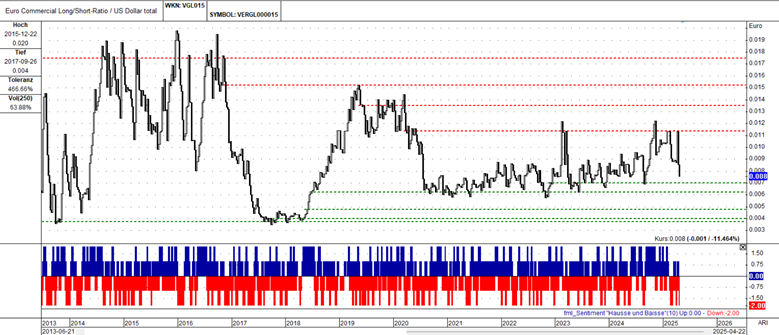
This unique chart offers a look at the relative positioning of commercial traders in the Euro compared to the total positioning in the US Dollar. By examining this ratio, we can gain insights into the comparative strength or weakness that commercial players are betting on between these two major currencies. The fluctuations in this ratio clearly illustrate the changing dynamics of commercial trader sentiment towards the Euro versus the US Dollar over time. A rising ratio suggests commercial traders are becoming more bullish on the Euro relative to the Dollar (or less bearish), while a falling ratio indicates the opposite. The sentiment indicator at the bottom provides a general sense of the overall bullish or bearish leaning within the broader market context.
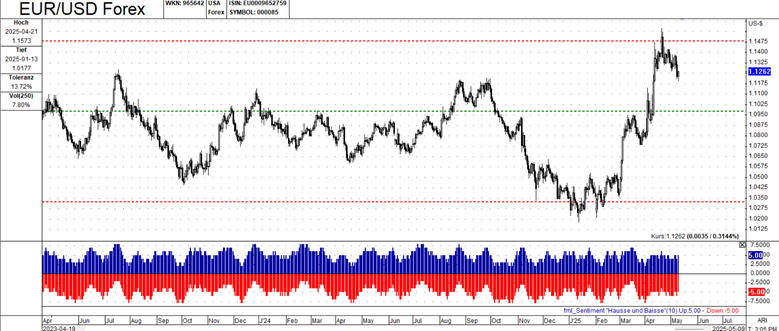
This is the chart most traders watch closely – the price movement of the EUR/USD currency pair. Understanding the trends, support, and resistance levels on this chart is fundamental for making informed trading decisions. The chart clearly shows a significant upward movement in the EUR/USD price after a period of consolidation or a previous downtrend. This indicates strong buying interest in the Euro relative to the US Dollar. The marked support levels (green lines) represent areas where buying pressure has historically emerged and could do so again. Conversely, the resistance levels (red lines) are price points where selling pressure has been strong and might lead to a pause or reversal of the uptrend. The sentiment indicator at the bottom aligns with the recent upward price action, showing a prevailing bullish sentiment in the market.
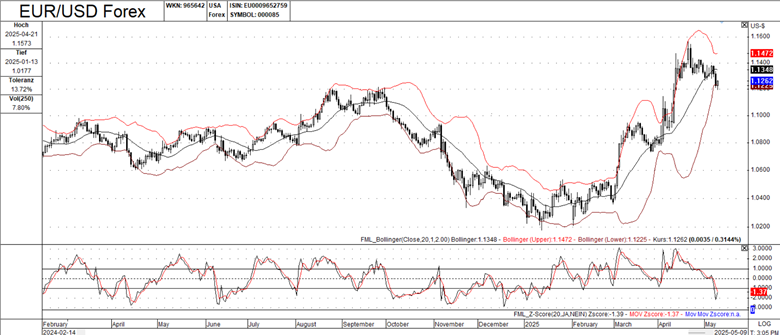
Bollinger Bands are a powerful tool that helps traders visualize the volatility of a market and identify potential overbought or oversold conditions. This chart applies Bollinger Bands to the EUR/USD price action, offering additional context to recent movements.
- Price Piercing the Upper Bollinger Band: The chart shows that the EUR/USD price recently moved above the upper Bollinger Band. This is often interpreted as a sign that the asset may be overbought in the short term, suggesting a potential for a downward price pullback or consolidation.
- Z-Score Indicator: The Z-Score indicator at the bottom measures how far the current price is from its moving average in terms of standard deviations. A positive Z-Score, as indicated here, confirms that the price is significantly above its average, further supporting the idea that the EUR/USD might be overextended.
The combination of the price moving above the upper Bollinger Band and a high positive Z-Score can be seen as a potential signal for a downward price reversal. However, it's crucial to look for further confirmation before making any trading decisions.
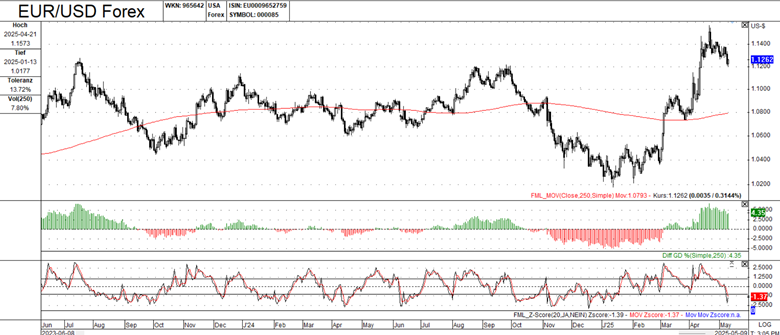
This chart layers on a simple moving average (SMA) and a DIFF CD oscillator to the EUR/USD price action. Moving averages help smooth out price fluctuations and identify the prevailing trend, while oscillators provide insights into the momentum and potential turning points in the market. The Z-Score is also present, offering further context on how extended the price is.
- The fact that the EUR/USD price is currently trading above the red simple moving average suggests that the recent uptrend remains intact, as the current price is above the average price over a specified period.
- The DIFF CD oscillator is showing positive momentum, which supports the bullish trend indicated by the moving average. This suggests that buying pressure is still present in the market.
- The presence of a high Z-Score reinforces the earlier observation from the Bollinger Bands analysis that the EUR/USD might be in overbought territory, warranting caution despite the positive trend and momentum.
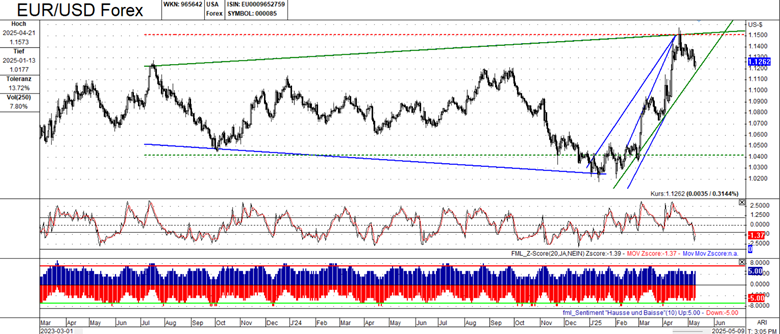
Trendlines are fundamental tools in technical analysis, helping traders visualize the direction and strength of a trend. This chart incorporates both short-term and longer-term trendlines, along with the sentiment indicator, to provide a comprehensive view of potential trend reversals and market bias for the EUR/USD pair. The chart highlights a significant breakout above a key trendline. This is often interpreted as a signal that the previous trend (likely a downtrend or consolidation) may be reversing, and a new trend (in this case, an uptrend) could be emerging. The sentiment indicator at the bottom is showing bullish sentiment, which aligns with the upward price movement and the trendline breakout. This confluence of signals can add conviction to a potential bullish outlook.
Key takeaways and cautions:
Several indicators (Bollinger Bands, Z-Score) suggest that the recent bullish move in EUR/USD might be overextended in the short term. Traders should be aware of the potential for a pullback or consolidation.
Author

FxPro Traders Research Team
FxPro Traders
The FxPro Traders Research Team delivers advanced analysis and strategies designed to empower your success in today's dynamic forex markets.


