Debate Aftermath Not a + for Markets

Good Morning Traders,
As of this writing 4:20 AM EST, here's what we see:
US Dollar: Dec. USD is Up at 98.565.
Energies: December Crude is Down at 50.55.
Financials: The Dec 30 year bond is Up 5 ticks and trading at 164.26.
Indices: The December S&P 500 emini ES contract is 21 ticks lower and trading at 2139.50.
Gold: The December gold contract is trading Down at 1265.10. Gold is 24 ticks lower than its close.
Initial Conclusion
This is a nearly correlated market. The dollar is Up+ and crude is Down- which is normal and the 30 year bond is trading Up. The Financials should always correlate with the US dollar such that if the dollar is lower then bonds should follow and vice-versa. The indices are Down and Crude is trading Down which is not correlated. Gold is trading Down which is correlated with the US dollar trading Up. I tend to believe that Gold has an inverse relationship with the US Dollar as when the US Dollar is down, Gold tends to rise in value and vice-versa. Think of it as a seesaw, when one is up the other should be down. I point this out to you to make you aware that when we don't have a correlated market, it means something is wrong. As traders you need to be aware of this and proceed with your eyes wide open.
Asia traded mixed with half the exchanges higher and the other half lower. As of this writing Europe is trading mixed as well.
Possible Challenges To Traders Today
– FOMC Member Tarullo Speaks at 10:15 AM EST. This is major.
– No real major economic news.
– Lack of major economic news.
Treasuries
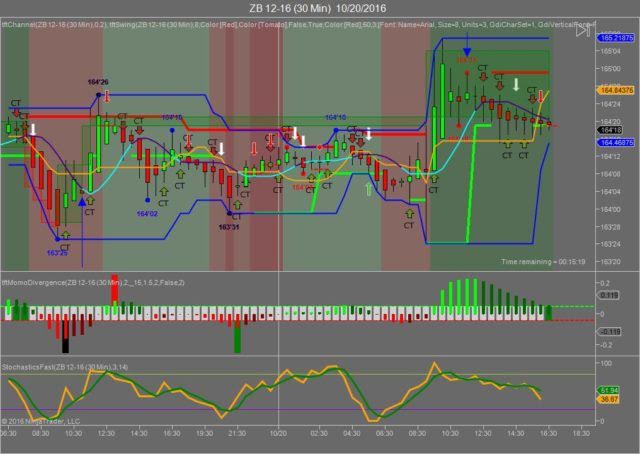
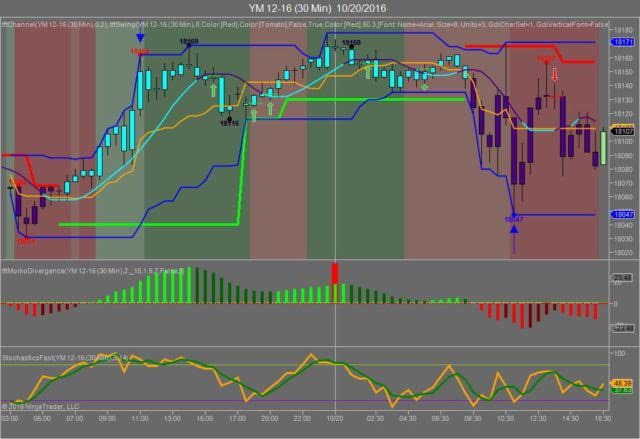
We've elected to switch gears a bit and show correlation between the 30 year bond (ZB) and The YM futures contract. The YM contract is the DJIA and the purpose is to show reverse correlation between the two instruments. Remember it's liken to a seesaw, when up goes up the other should go down and vice versa.
Yesterday the ZB made it's move at around 11 AM EST when most of the economic news was reported. The ZB hit a high at around that time and the YM hit a low. If you look at the charts below ZB gave a signal at around 11 AM EST and the YM was moving higher at the same time. Look at the charts below and you'll see a pattern for both assets. ZB hit a high at around 11 AM EST and the YM hit a low. These charts represent the latest version of Trend Following Trades and I've changed the timeframe to a 30 minute chart to display better. This represented a shorting opportunity on the 30 year bond, as a trader you could have netted about 20 plus ticks per contract on this trade. Each tick is worth $31.25. We added a Donchian Channel to the charts to show the signals more clearly.
Charts Courtesy of Trend Following Trades built on a NinjaTrader platform
Bias
Yesterday we gave the markets a neutral bias as the USD and the Bonds were trading higher yesterday morning and ordinarily we would say that this was a downside signal EXCEPT yesterday morning the indices were moving higher hence the neutral bias which means the markets could go in any direction. Today we are dealing with a nearly correlated market. Unfortunately it's correlated to the downside, hence our bias is to the downside.
Could this change? Of Course. Remember anything can happen in a volatile market
Commentary
If you followed the Presidential debates from the beginning one would have thought that the markets should have gone up yesterday with the the thought that Hillary won these debates. If it were only that easy. Yesterday we suggested a neutral bias which means the markets could go in any direction and ironically that's what happened on the Dow. First down, then up, then down again. The economic news didn't help much as Unemployment Claims went up coming in at 260k when 251K was expected. Unemployment Claims always play a critical role this close to Election Day in a Presidential year and yesterday was no exception. Today we only have an FOMC Member speaking at 10:15 AM EST with no other economic news in sight.
Author

Nick Mastrandrea
Market Tea Leaves


