Dead Cat Bounce [Video]
![Dead Cat Bounce [Video]](https://editorial.fxstreet.com/images/Markets/Equities/stock-certificates-11742678_XtraLarge.jpg)
US Dollar: June USD is Down at 97.245.
Energies: June '19 Crude is Down at 61.15.
Financials: The Jun 30 year bond is Up 15 ticks and trading at 149.21.
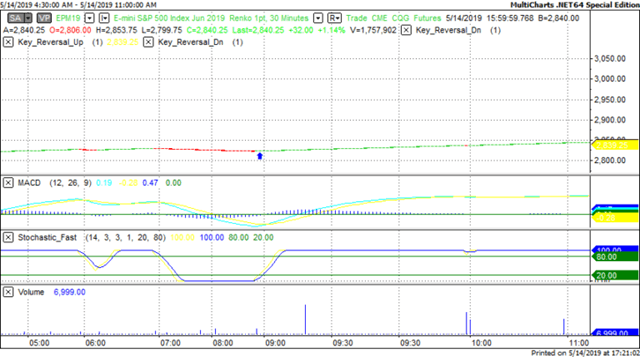
Indices: The June S&P 500 emini ES contract is 2 ticks Lower and trading at 2838.75.
Gold: The June Gold contract is trading Up at 1299.50. Gold is 32 ticks Higher than its close.
Initial Conclusion
This is not a correlated market. The dollar is Down- and Crude is Down- which is not normal but the 30 year Bond is trading Higher. The Financials should always correlate with the US dollar such that if the dollar is lower then bonds should follow and vice-versa. The S&P is Lower and Crude is trading Lower which is not correlated. Gold is trading Higher which is correlated with the US dollar trading Down. I tend to believe that Gold has an inverse relationship with the US Dollar as when the US Dollar is down, Gold tends to rise in value and vice-versa. Think of it as a seesaw, when one is up the other should be down. I point this out to you to make you aware that when we don't have a correlated market, it means something is wrong. As traders you need to be aware of this and proceed with your eyes wide open.
All of Asia is trading Higher with the exception of the Singapore exchange which is fractionally lower. Conversely all of Europe is trading Lower with the exception of the London exchange which is fractionally Higher.
Possible Challenges To Traders Today
-
Retail Sales is out at 8:30 AM EST. This is major.
-
Core Retail Sales is out at 8:30 AM EST. This is major.
-
Empire State Manufacturing Index is out at 8:30 AM EST. This is major.
-
Capacity Utilization Rate is out at 9:15 AM EST. This is major.
-
Industrial Production m/m is out at 9:15 AM. This is major.
-
FOMC Member Quarles Speaks at 9:30 AM. This is major.
-
Business Inventories m/m is out at 10 AM EST. Major.
-
NAHB Housing Market Index is out at 10 AM EST. This is Major.
-
Mortgage Delinquencies. This is Major.
-
Crude Oil Inventories is out at 10:30 AM EST. This is Major.
-
TIC Long-Term Purchases is out at 4 PM. This is not major.
Treasuries
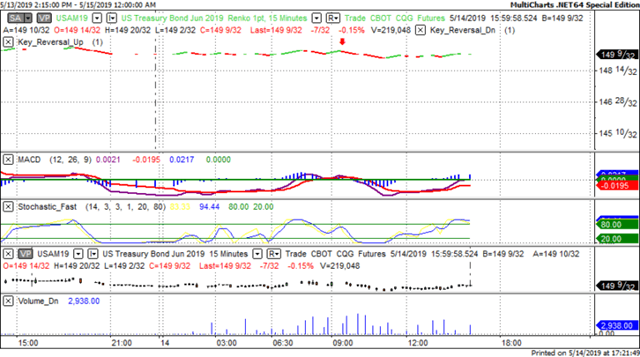
We've elected to switch gears a bit and show correlation between the 30 year bond (ZB) and The YM futures contract. The YM contract is the DJIA and the purpose is to show reverse correlation between the two instruments. Remember it's liken to a seesaw, when up goes up the other should go down and vice versa.
Yesterday the ZB made a major move at around 9 AM EST. The ZB hit a High at around that time and the YM hit a Low. If you look at the charts below ZB gave a signal at around 9 AM EST and the YM was moving Higher at the same time. Look at the charts below and you'll see a pattern for both assets. ZB hit a High at around 9 AM and the YM was moving Higher at the same time. These charts represent the newest version of MultiCharts and I've changed the timeframe to a 15 minute chart to display better. This represented a Shorting opportunity on the 30 year bond, as a trader you could have netted about 12 ticks per contract on this trade. Each tick is worth $31.25. Please note: the front month for the ZB contract is now June, 2019 and I've changed the format to Renko bars such that it may be more apparent and visible.
Charts Courtesy of MultiCharts built on an AMP platform.
Bias
Yesterday we gave the markets an Upside bias as the USD, Gold and the Bonds were all trading Lower yesterday morning and tis bodes well for an Upside day. The markets didn't disappoint as the Dow rose 207 points and the other indices gained ground as well. Today we aren't dealing with a correlated market and our bias is Neutral.
Could this change? Of Course. Remember anything can happen in a volatile market.
Commentary
Yesterday morning when we viewed the markets we felt that this was a good situation for a dead cat bounce and in fact we mentioned it in our video (only available to subscribers). What's a dead cat bounce? It's the situation whereby the market has fallen (usually for more than one day) with traders shorting the market hoping to capitalize on the downside. Eventually and inevitably the short must be covered by a buy back. When enough of these happens it changes market direction to the upside. The big question now is will that trend continue?
Author

Nick Mastrandrea
Market Tea Leaves


