Dead cat bounce strikes again [Video]
![Dead cat bounce strikes again [Video]](https://editorial.fxstreet.com/images/Markets/Currencies/Majors/DollarIndex/coin-of-the-united-states-dollar-gm486202853-38323302_XtraLarge.jpg)
US Dollar: Dec '22 USD is Up at 112.105.
Energies: Nov '22 Crude is Down at 84.24.
Financials: The Dec '22 30 Year note is Down 6 ticks and trading at 123.06.
Indices: The Dec '22 S&P 500 emini ES contract is 224 ticks Higher and trading at 3745.25.
Gold: The Dec'22 Gold contract is trading Down at 1657.80. Gold is 62 ticks Lower than its close.
Initial conclusion
This is not a correlated market. The dollar is Up, and Crude is Down which is normal, but the 30-year Bond is trading Lower. The Financials should always correlate with the US dollar such that if the dollar is lower, then the bonds should follow and vice-versa. The S&P is Higher, and Crude is trading Lower which is correlated. Gold is trading Lower which is correlated with the US dollar trading Up. I tend to believe that Gold has an inverse relationship with the US Dollar as when the US Dollar is down, Gold tends to rise in value and vice-versa. Think of it as a seesaw, when one is up the other should be down. I point this out to you to make you aware that when we don't have a correlated market, it means something is wrong. As traders you need to be aware of this and proceed with your eyes wide open. Currently all of Asia is trading Higher with the exception of the Shanghai exchange. Currently all of Europe is trading Higher.
Possible challenges to traders today
-
Capacity Utilization Rate is out at 9:15 AM EST. Major.
-
Industrial Production m/m is out at 9:15 AM EST. Major.
-
NAHB Housing Market Index is out at 10 AM EST. Major.
-
Federal Budget Balance - tentative, this is Major.
-
TIC Long-Term Purchases - No impact, out at 4 PM EST.
Treasuries
Traders, please note that we've changed the Bond instrument from the 30 year (ZB) to the 10 year (ZN). They work exactly the same.
We've elected to switch gears a bit and show correlation between the 10-year bond (ZN) and the S&P futures contract. The S&P contract is the Standard and Poor's, and the purpose is to show reverse correlation between the two instruments. Remember it's likened to a seesaw, when up goes up the other should go down and vice versa.
Yesterday the ZN made its move at around 9:45 AM EST. The ZN hit a High at around that time and the S&P moved Higher shortly thereafter. If you look at the charts below ZN gave a signal at around 9:45 AM and the S&P gave a signal at around the same time. Look at the charts below and you'll see a pattern for both assets. ZN hit a High at around 9:45 AM and the S&P moved Higher shortly thereafter. These charts represent the newest version of MultiCharts and I've changed the timeframe to a 15-minute chart to display better. This represented a Shorting opportunity on the 10-year note, as a trader you could have netted about 20 ticks per contract on this trade. Each tick is worth $15.625. Please note: the front month for the ZN is now Dec '22. The S&P contract is also Dec' 22. I've changed the format to Renko Bars such that it may be more apparent and visible.
Charts courtesy of MultiCharts built on an AMP platform
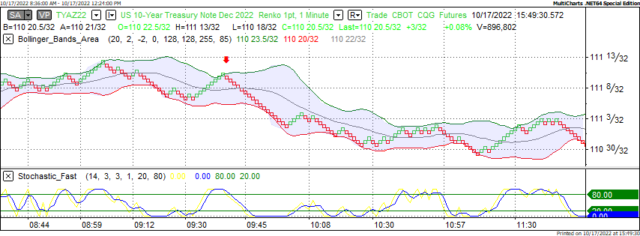
ZN - Dec 2022 - 10/17/22
-638016883369227029.png)
S&P - Dec 2022 - 10/17/22
Bias
Yesterday we gave the markets a Neutral bias as we didn't see much in the way of correlation Monday morning. The Dow went Higher by about 551 points and the other indices gained ground as well. Today we aren't dealing with a correlated market and our bias is to the Upside.
Could this change? Of Course. Remember anything can happen in a volatile market.
Commentary
Yesterday we witnessed something that we see occasionally in the markets; that being a dead cat bounce. For those you aren't aware a dead cat bounce is the scenario where the markets go low because everyone is shorting the markets as they're going down. However, in order to capitalize on that situation and "take money off the table" the trader must buy back the shares or contracts they sold short. This creates the situation where there are now mor buyers than sellers and by default the markets rise. When that starts to happen seller switch gears and go long to capitalize on the Upswing and now you a bullish trend and direction. This is precisely what happened yesterday. Today we have Capacity Utilization, Industrial Production and the NAHB Housing Market Index, all of which are major and proven market movers. Will this keep the upswing in place? Only time will tell.
Author

Nick Mastrandrea
Market Tea Leaves


