Dead cat bounce or other? [Video]
![Dead cat bounce or other? [Video]](https://editorial.fxstreet.com/images/Markets/Bonds/Bond/united-states-savings-bonds-5771335.jpg)
US Dollar: Mar '22 USD is Down at 95.830.
Energies: Mar '22 Crude is Up at 93.15.
Financials: The Mar '22 30 Year bond is Up 4 ticks and trading at 150.28.
Indices: The Mar '22 S&P 500 Emini ES contract is 12 ticks Lower and trading at 4461.50.
Gold: The Apr'22 Gold contract is trading Down at 1856.00. Gold is 2 ticks Lower than its close.
Initial conclusion
This is not a correlated market. The dollar is Down, and Crude is Up which is normal, but the 30-year Bond is trading Higher. The Financials should always correlate with the US dollar such that if the dollar is lower, then the bonds should follow and vice-versa. The S&P is Lower, and Crude is trading Higher which is correlated. Gold is trading Lower which is not correlated with the US dollar trading Down. I tend to believe that Gold has an inverse relationship with the US Dollar as when the US Dollar is down, Gold tends to rise in value and vice-versa. Think of it as a seesaw, when one is up the other should be down. I point this out to you to make you aware that when we don't have a correlated market, it means something is wrong. As traders you need to be aware of this and proceed with your eyes wide open. Currently, Asia is trading mainly Higher with the exception of the Sensex exchange which is Lower. Europe is trading mainly Higher at this time with the exception of the London and Milan exchanges which are Lower.
Possible challenges to traders today
-
Core Retail Sales is out at 8:30 AM EST. This is Major.
-
Retail Sales is out at 8:30 AM EST. This is Major.
-
Import Prices is out at 8:30 AM EST. This is Major.
-
Industrial Production is out at 9:15 AM EST. This is Major.
-
Capacity Utilization Rate is out at 9:15 AM EST. This is Major.
-
Business Inventories is out at 10 AM EST. This is Major.
-
Mortgage Delinquencies - Tentative. Major.
-
NAHB Housing Market Index is out at 10 AM EST. Major.
-
Crude Oil Inventories is out at 10:30 AM EST. This is Major.
-
FOMC Meeting Minutes is out at 2 PM EST. This is Major.
Treasuries
Traders, please note that we've changed the Bond instrument from the 30 year (ZB) to the 10 year (ZN). They work exactly the same.
We've elected to switch gears a bit and show correlation between the 10-year bond (ZN) and the S&P futures contract. The S&P contract is the Standard and Poor's, and the purpose is to show reverse correlation between the two instruments. Remember it's likened to a seesaw, when up goes up the other should go down and vice versa.
Yesterday the ZN made its move at around 11:30 AM EST. The ZN hit a High around that time and the S&P moved Higher. If you look at the charts below ZN gave a signal at around 11:30 AM EST and the S&P moved Higher at around the same time. Look at the charts below and you'll see a pattern for both assets. ZN hit a High at around 11:30 AM EST and the S&P was moving Higher shortly thereafter. These charts represent the newest version of MultiCharts and I've changed the timeframe to a 30-minute chart to display better. This represented a Shorting opportunity on the 10-year note, as a trader you could have netted about a dozen ticks per contract on this trade. Each tick is worth $15.625. Please note: the front month for the ZN is now Mar '22. The S&P contract is now Mar '22 as well. I've changed the format to Renko bars such that it may be more apparent and visible.
Charts courtesy of MultiCharts built on an AMP platform
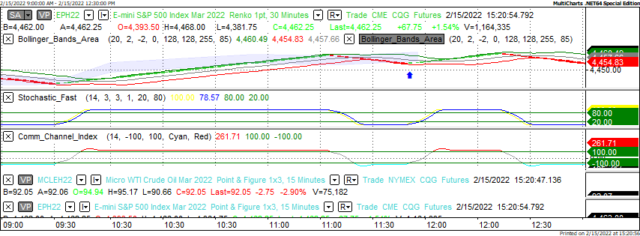
ZN - Mar 2022 - 02/15/22
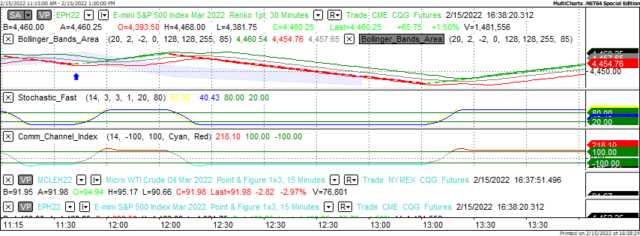
S&P - Mar 2022 - 02/15/22
Bias
Yesterday we gave the markets an Upside bias as both the USD and the Bonds were trading Lower, and this usually reflects a Upside Day. The markets didn't disappoint as the Dow gained 423 points and the other indices gained ground as well. Today we aren't dealing with a correlated market and our bias is Neutral or Mixed.
Could this change? Of Course. Remember anything can happen in a volatile market.
Commentary
Yesterday we suggested an Upside Day based purely on principles of Market Correlation. Many analysts have suggested that the reason the markets advanced was because dialogue has resumed with Russia concerning the Ukraine situation. Whereas there may be some measure of truth to this, our readers knew hours in advance of the market open. In addition, the markets advanced in spite of not too stellar economic news. The PPI numbers advanced (which is not good for inflation) and the Empire State Manufacturing Index dropped. Today we have a virtual news tsunami in terms of economic reports. In total we have 10 news reports out today. Will the markets remain in an upward trend? Only time will tell...
Author

Nick Mastrandrea
Market Tea Leaves
Nick Mastrandrea over 20 years experience in trading and formerly held a NASD Series 7. He currently holds a NJ Life, Health and Variable Authority. Nick is a published writer and his work has appeared in Futures Magazine, TraderPlanet and others.


